Identify Abnormal Patterns & Deviations
Anomaly Detection Software for Your Data
Find anomalous data and take action before it affects downstream models, dashboards, and reports.
Trusted by Industry Leaders
Anomaly Detection Systems
Machine learning algorithms for anomaly detection
Monitor your data quality automatically without the need for manual rules
- Uses AI to understand your data’s normal patterns and detect anomalies in your key tables, including issues a human wouldn’t anticipate
- Scales seamlessly to handle increasing data volumes and complexities, ensuring consistent performance
- Easy for everyone, API or no-code configuration
- Allows users to set and adjust anomaly detection thresholds based on specific needs and priorities


Identify Outliers
Automated monitoring of data values
Go beyond data observability to detect when data is outside of the norm
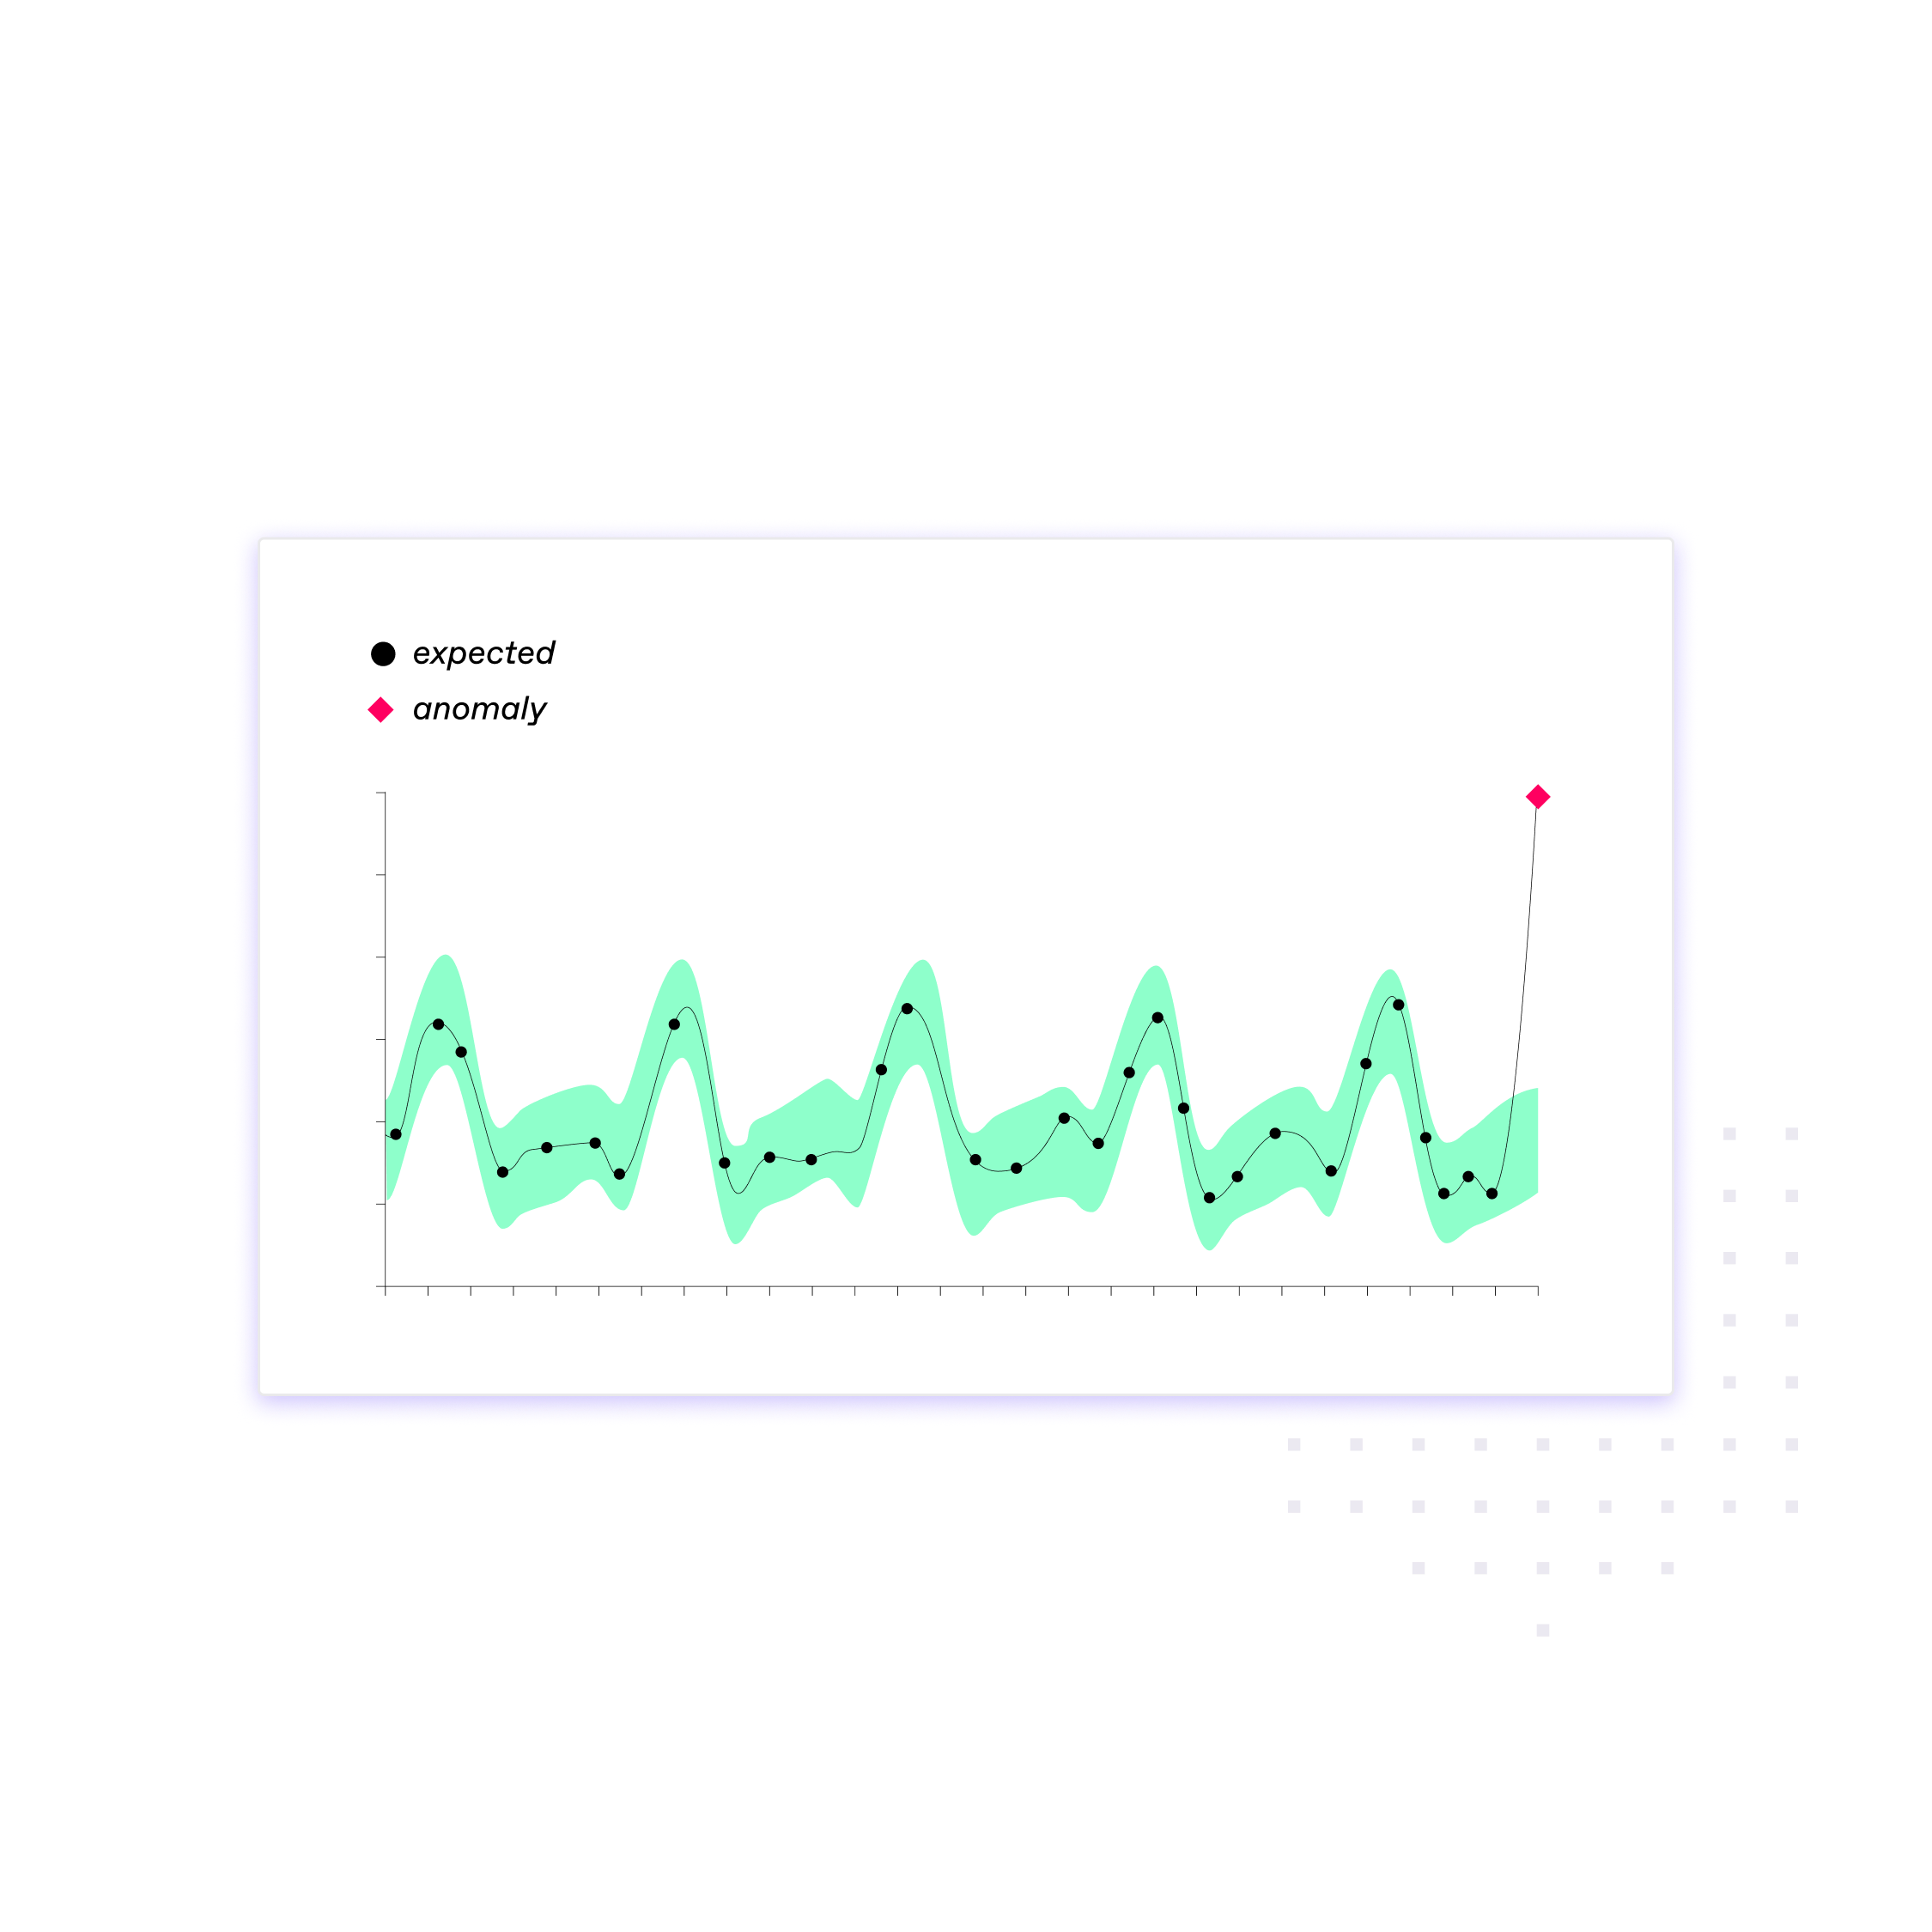
- Find spikes and drops in data segments
- Get a severity score with each alert
- Take action to prevent outliers from impacting your business
Smart Alerts
Automated routing and noise prevention with AI
Stop alerts from becoming a distraction with monitoring that adapts to your data
- Machine learning
- Sophisticated routing and notification channel options
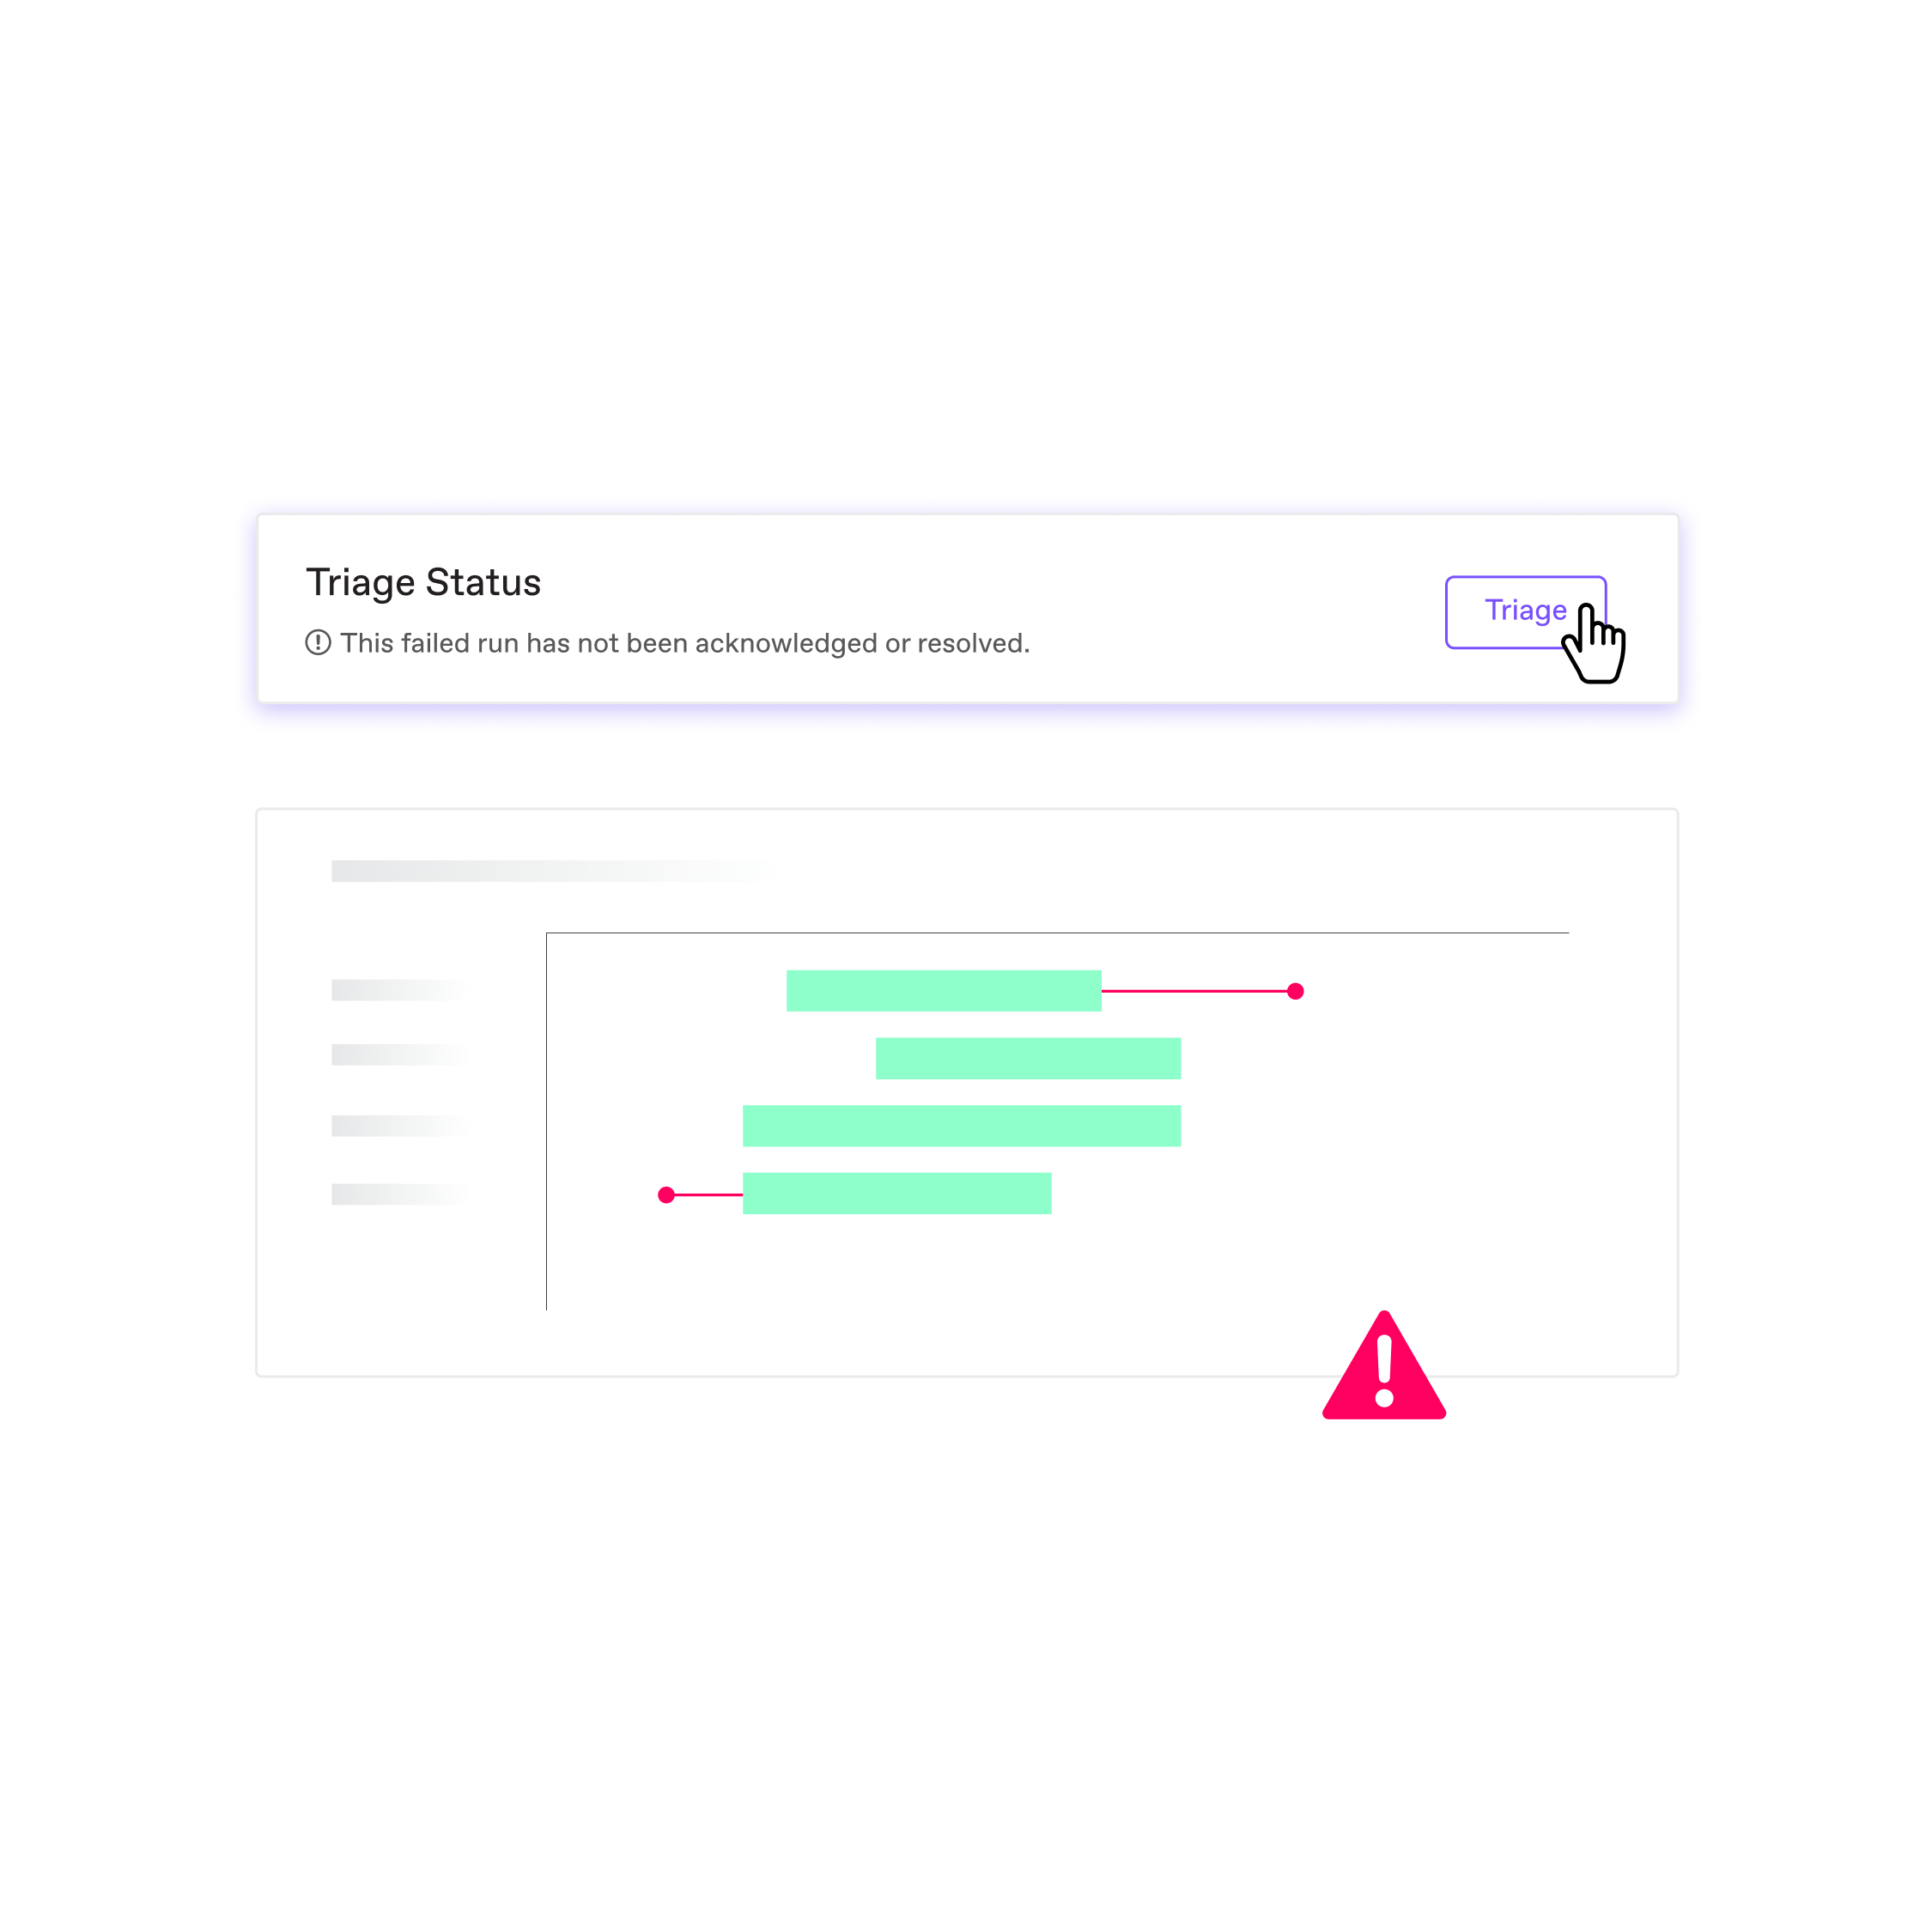
- Built-in triage and root cause analysis


Data Patterns
Understand how your data changes over time
Machine learning anomaly detection learns your data’s trends and correlations
- Track KPIs for your tables automatically
- Understand when to retrain models due to data drift
- Explore your data with rich visualizations
Ready to Get Started?
Key Benefits
Anomaly Detection Tools
Reduce alert fatigue
Noisy, annoying alerts are a common reason that data quality initiatives fail. Machine learning is smart enough to know when there’s a true anomaly vs. an expected fluctuation.
Protect your models
AI models will behave erratically when data inputs have shifted, in ways that are hard to catch. With Anomalo, you can detect changes before they affect the models that power your business.
Find “unknown unknowns”
Manual rules and thresholds can only go so far. Machine learning anomaly detection finds the issues you didn’t plan for in advance.
FAQ
Frequently Asked Questions
If you have additional questions, we are happy to answer them.
Why is anomaly detection important and how does Anomalo handle different types of data?
Anomaly detection is important for identifying irregularities, outliers, or potential threats within data, facilitating timely intervention and risk mitigation. Anomalo’s machine learning algorithms are trained on numerous benchmark datasets that closely resemble the size and complexity of real business data. We actually introduce “chaos” into these datasets in the form of realistic data anomalies and data quality issues, and ensure that our models are tuned to detect these problems and generate alerts with the right levels of sensitivity. Anomaly checks can work on any type of data, but the table should have at least 100 rows per day for the algorithm to be effective.
How frequently does Anomalo’s AI-based, automated anomaly detection system run?
Most business data is updated on a regular daily cadence. To provide a cost-effective solution, Anomalo also runs the anomaly checks on a daily basis, after confirming that the table has indeed been updated and all of the new data has been completely delivered. Based on your needs, you can always set up a custom schedule as well.
Do Anomalo’s anomaly detection capabilities come with customizable thresholds and rules?
Yes, of course! Our machine learning models will automatically learn what “normal” looks like for each of your tables and only alert if something is outside the norm, but you can always fine-tune our detection parameters. You can set rules and thresholds right in the Anomalo UI, without needing to write any code.
How does Anomalo handle false positives?
Unlike other monitoring platforms that can generate noisy alerts, Anomalo automatically reduces false positives with unsupervised machine learning algorithms that understand the patterns in your data. It learns when a data change is just an expected fluctuation, vs. when it’s severe enough to be truly anomalous. You can always tune Anomalo’s alerts to be more or less sensitive, too.
What integration options are available with other data sources or platforms?
Anomalo offers easy one-click integrations with all the major data warehouses/lakes/lakehouses, ETL tools, data catalogs, and alerting platforms. To learn more, visit our Integrations page.
What algorithms does Anomalo utilize for anomaly detection?
Anomalo uses unsupervised anomaly detection techniques. Taking on a sample of 10,000 records from the most recent data and comparison samples from previous days, our machine learning algorithms will search for ways that the existing dataset is different from those previous days. If detected changes are above a dynamically adjusted threshold, which is based on the historical data “chaos” or levels of fluctuation in the data, this check will fail.
How much time do Anomalo’s models need to learn about my data?
The machine learning algorithms need to run for 2 weeks to produce useful results. Results will continue to improve over the next 30–60 days. When a table is newly configured, the dynamically-adjusted threshold will be set to the maximum score, which requires anomalies to be extreme. Gradually, the threshold will decrease as the anomaly detection algorithms learn the expected chaos for the table.
How does Anomalo’s root cause analysis help me understand anomalous data points?
With automated root cause analysis, you can download a sample of a “good” and “bad” data point every time Anomalo flags an issue. Anomalo also will highlight the columns and data segments that contain the largest portions of anomalous data points, compared to normal data. These tools and visualizations will help you pinpoint the anomaly in your data.
Ready to Trust Your Data? Let’s Get Started
Meet with our team to see how Anomalo transforms data quality from a challenge into a competitive edge.


