Effective Data Monitoring: Steps to Minimize False Alerts
March 17, 2021
Every time a data alert fires (or fails to fire), one of four possible outcomes occurs.
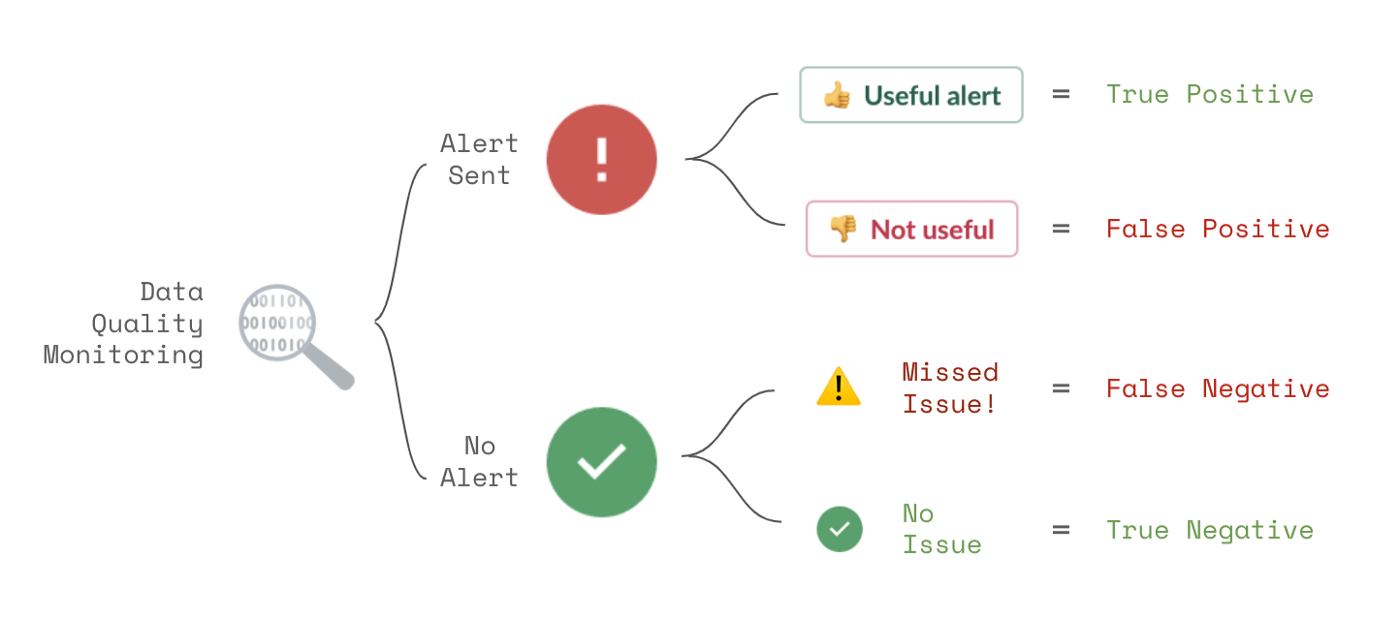
In a perfect world, every alert received would be about a real data quality issue you cared about (a true positive). No alerts would be sent when there were no issues you cared about (a true negative).
In reality, most data quality monitoring solutions are far from perfect. They send alerts that are not useful (false positives). These distract your data team and erode confidence in your monitoring solution.
Or real data quality issues are missed by the monitoring tool (false negatives). These compromise your business decisions and data products and erode trust in your data.
In this article, we will cover ten steps you can take to reduce false positive and false negative alerts and to mitigate their impact when they do occur.
1. Use dynamic data testing strategies
Most data testing strategies begin with simple rules, such as:
- column x is never NULL
- table y row count is between 1,000,000 and 2,000,000
These rules are perfect for cases where you know exactly how you want your data to behave. But they come with several drawbacks:
- Any violation of the rule, no matter how small, generates an alert.
- They require time from data subject matter experts to create.
- They may need frequent maintenance over time as your data changes.
You can reduce your false positives and false negatives by using dynamic data testing strategies.

Dynamic tests use time series models (or other machine learning techniques) to adapt to your data over time and alert only when there is a sudden meaningful change. Such tests require less work to set up and increase test coverage while reducing false positives caused by misconfiguration or data drift over time.
2. Check only the latest data by default
By default, your platform should only check the most recent data in a table.

Limiting checks to the latest data saves data warehouse costs and reduces false positive alerts from historical data that you no longer care to fix. It should be easy for users to disable this for any tables that are not append-only.
Checks can also keep track of their run history and send notifications only when encountering new issues in the table.
3. Support no-code configuration changes
Inevitably a data quality rule will generate a false positive alert. In these cases, users should be able to adjust their checks easily. Users will be reluctant to make changes if they have to edit code or change a complex YAML configuration file.
The types of changes users often make include:
- Widening the expected range for a data outcome
- Narrowing the scope of a rule using a where SQL clause
- Waiting for updated-in-place data to arrive before applying a rule
- Changing thresholds for machine learning alerts
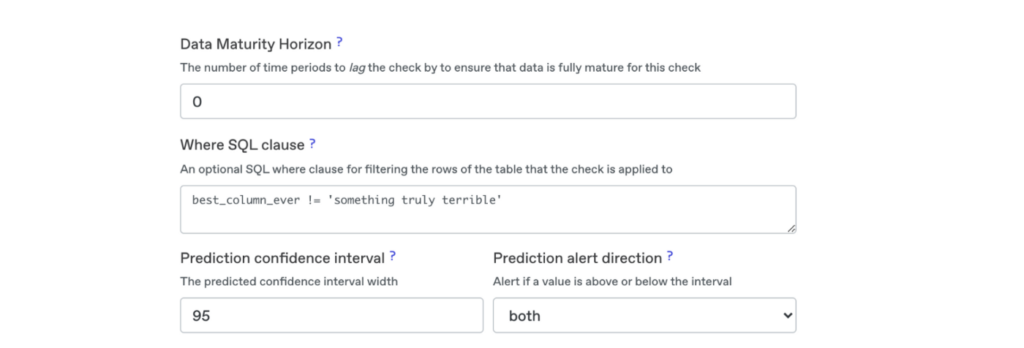
The UI to make changes should be one click away from the alert. It should be easy to understand and well documented. Finally, there should be an audit trail of changes to allow for easy reversion if needed.
4. Prioritize your data quality rules
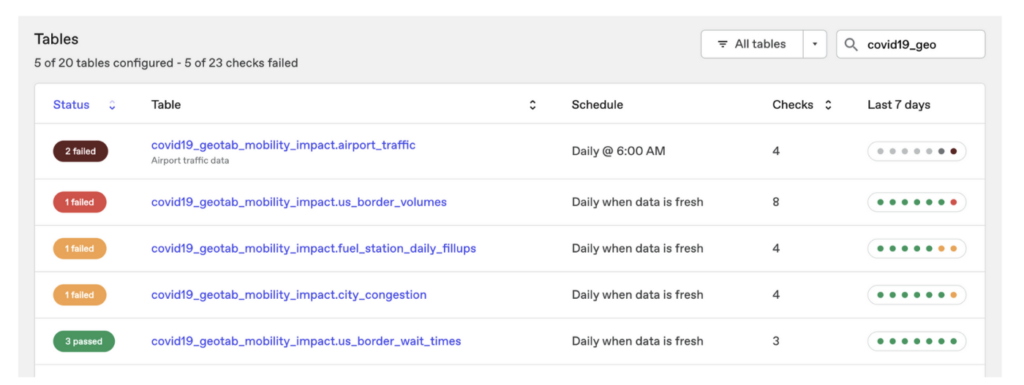
Not all data quality rules are equally important. In some cases, users may be experimenting with the platform and don’t want to be alerted. In other cases, rules may be critically important, and any deviation from expected behavior should generate loud alerts.

In addition to changing alert behavior, priority levels can also change how alerts or tables appear in dashboards based upon the severity of failing alerts.
5. Use APIs to run high priority rules in your pipelines
For data validations where you have very high confidence that any issues would be real and have significant adverse consequences, it can make sense to run these alerts in your pipelines.
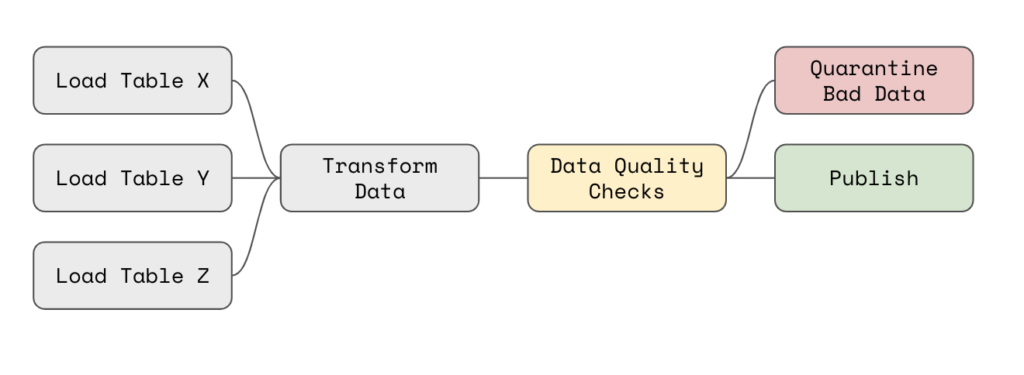
For example, in Apache Airflow, you could use an API to execute data quality checks on transformed data and then poll for check results and publish data if there are no failures.
If a check does fail, you could run automated tasks to fix the bad data, abort the remainder of the DAG (sometimes, no data is better than bad data), or quarantine bad records using SQL produced in the API to query for good and bad data.
6. Cluster similar issues together into single alerts
Data quality issues often strike multiple columns or segments of data at the same time. Such cases should be correlated together into a single alert if they affect the same rows of data.

In the above (masked) alert, three of 88 columns have an unusual increase in NULL values in the same rows of data. Clustering reduces the number of alerts the team has to review and can help identify the underlying issue.
7. Scan samples of raw data rows for any unexpected changes
With many important source tables, each containing hundreds of data columns, manually specifying and managing data quality rules for each source and column is untenable.
Instead, use unsupervised data monitoring to scan random samples of rows in source tables for significant anomalies.

A summary like the one above can be reviewed regularly to quickly identify unexpected and concerning changes that should be addressed and monitored explicitly in the future.
8. Route notifications to teams with ownership and accountability
Many companies initially route all of their data quality alerts to a single channel in Slack or Microsoft Teams. However, users in that channel will have to ignore many alerts they may not be interested in. A single channel can also reduce the accountability for addressing individual alerts, as they are easily lost in the channel noise.
Instead, a best practice is to set up separate channels for individual teams.

In each team channel, you can include users who depend upon or maintain the tables that are routed to that channel. As alerts arrive, they can use emoji reactions to classify their response to alerts.

Common reactions include:
- ✅ the issue has been fixed
- 🔥 an important alert
- 🛠️ a fix is underway
- 🆗 expected behavior, nothing needed
- 👀 under review
Or users can @ mention their colleagues in a thread to diagnose and resolve the underlying issue.
9. Provide actionable context for issues to accelerate triage
When an alert fires, it is frustrating to get a message like:
column user_id in table fact_table has NULL values
This alert puts the onus on the user to answer questions like:
- Why does this alert matter?
- What # and % of user_id values are affected?
- How often has this alert failed in the recent past?
- Who configured this alert, and why?
- What dashboards or ML models depend on fact_table?
- What raw data source contributed user_id to fact_table ?
Notifications should include this information directly or link to data catalog platforms that do.
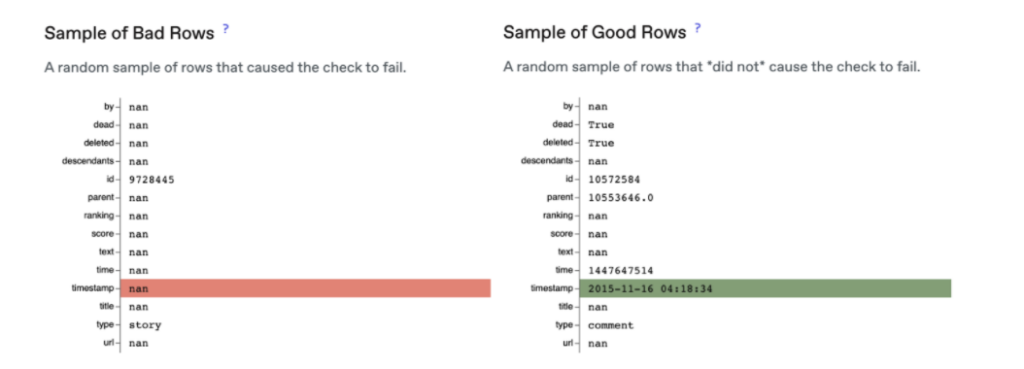
Additionally, notifications should include samples of raw data that highlight good and bad values:
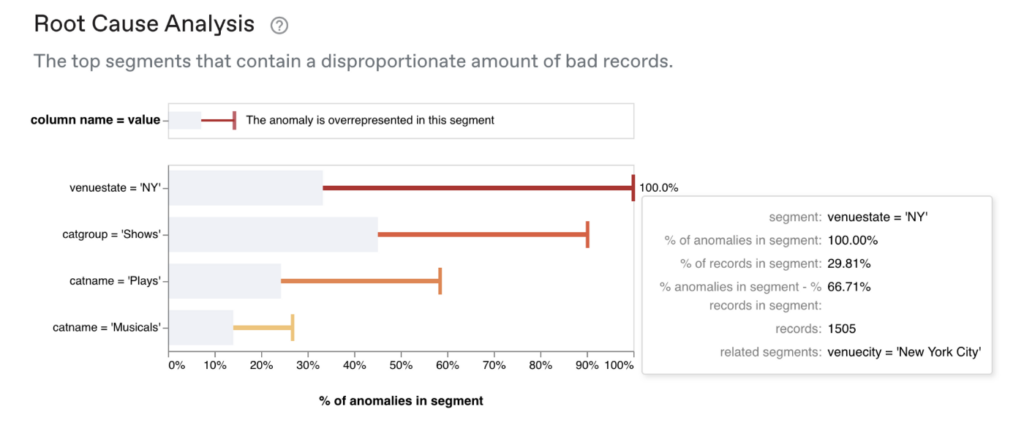
Advanced statistical methods can analyze the underlying data and produce root cause analyses that identify exactly where the issue is occurring.
10. Collect and learn from user feedback
Inevitably, your data quality solution will send alerts that are not useful. In these cases, it is important to collect that feedback.
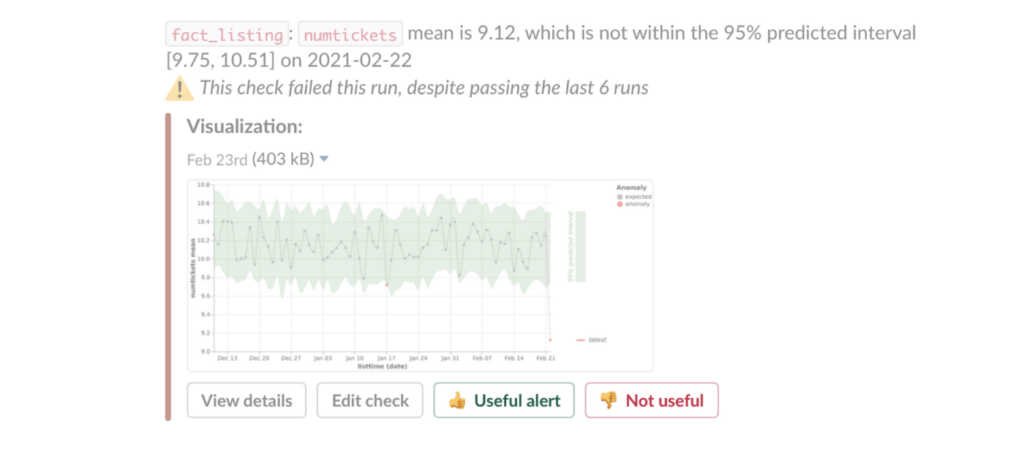
Over time, a data quality monitoring solution can be tuned using machine learning to suppress alerts that users do not find useful.

To effectively monitor your data, your system should produce comprehensive, targeted, and accurate alerts.
First, be sure to minimize false-positive alerts. Migrate static tests to more intelligent dynamic tests that adjust with your data. Ensure users can adjust alert priorities and subscribe to notifications they care about. Check only the latest data by default and make it easy for rules to be edited.
Next, reduce the burden on users of false-positive alerts. Cluster similar issues together and provide the right with alerts. Use API integrations to prevent bad data from continuing through pipelines. Then ensure your system can adapt to user feedback over time.
Finally, make your testing strategy comprehensive enough that you do not miss real data quality issues (false negatives). Use dynamic testing and user-friendly interfaces to make configuring alerts easy. And leverage row-level unsupervised monitoring to scan for issues your other alerts miss.
Combined, these solutions ensure your alerts are high quality, your users are productive and engaged, and the quality of the data you depend upon keeps increasing over time.
To learn more about how data teams use Anomalo to reduce false positive and false negative alerts, request a demo.
Get Started
Meet with our expert team and learn how Anomalo can help you achieve high data quality with less effort.


