Effective Data Monitoring, No Matter The Scale
The Data Observability Tool You Can Count On
Automatically monitor data volume, freshness, and more key health indicators across all your tables. Go deeper when you need with custom rules, metrics monitoring, and AI-based checks.
Trusted by Industry Leaders
Data Observability Tool
Improve trust in your data with observability you can count on
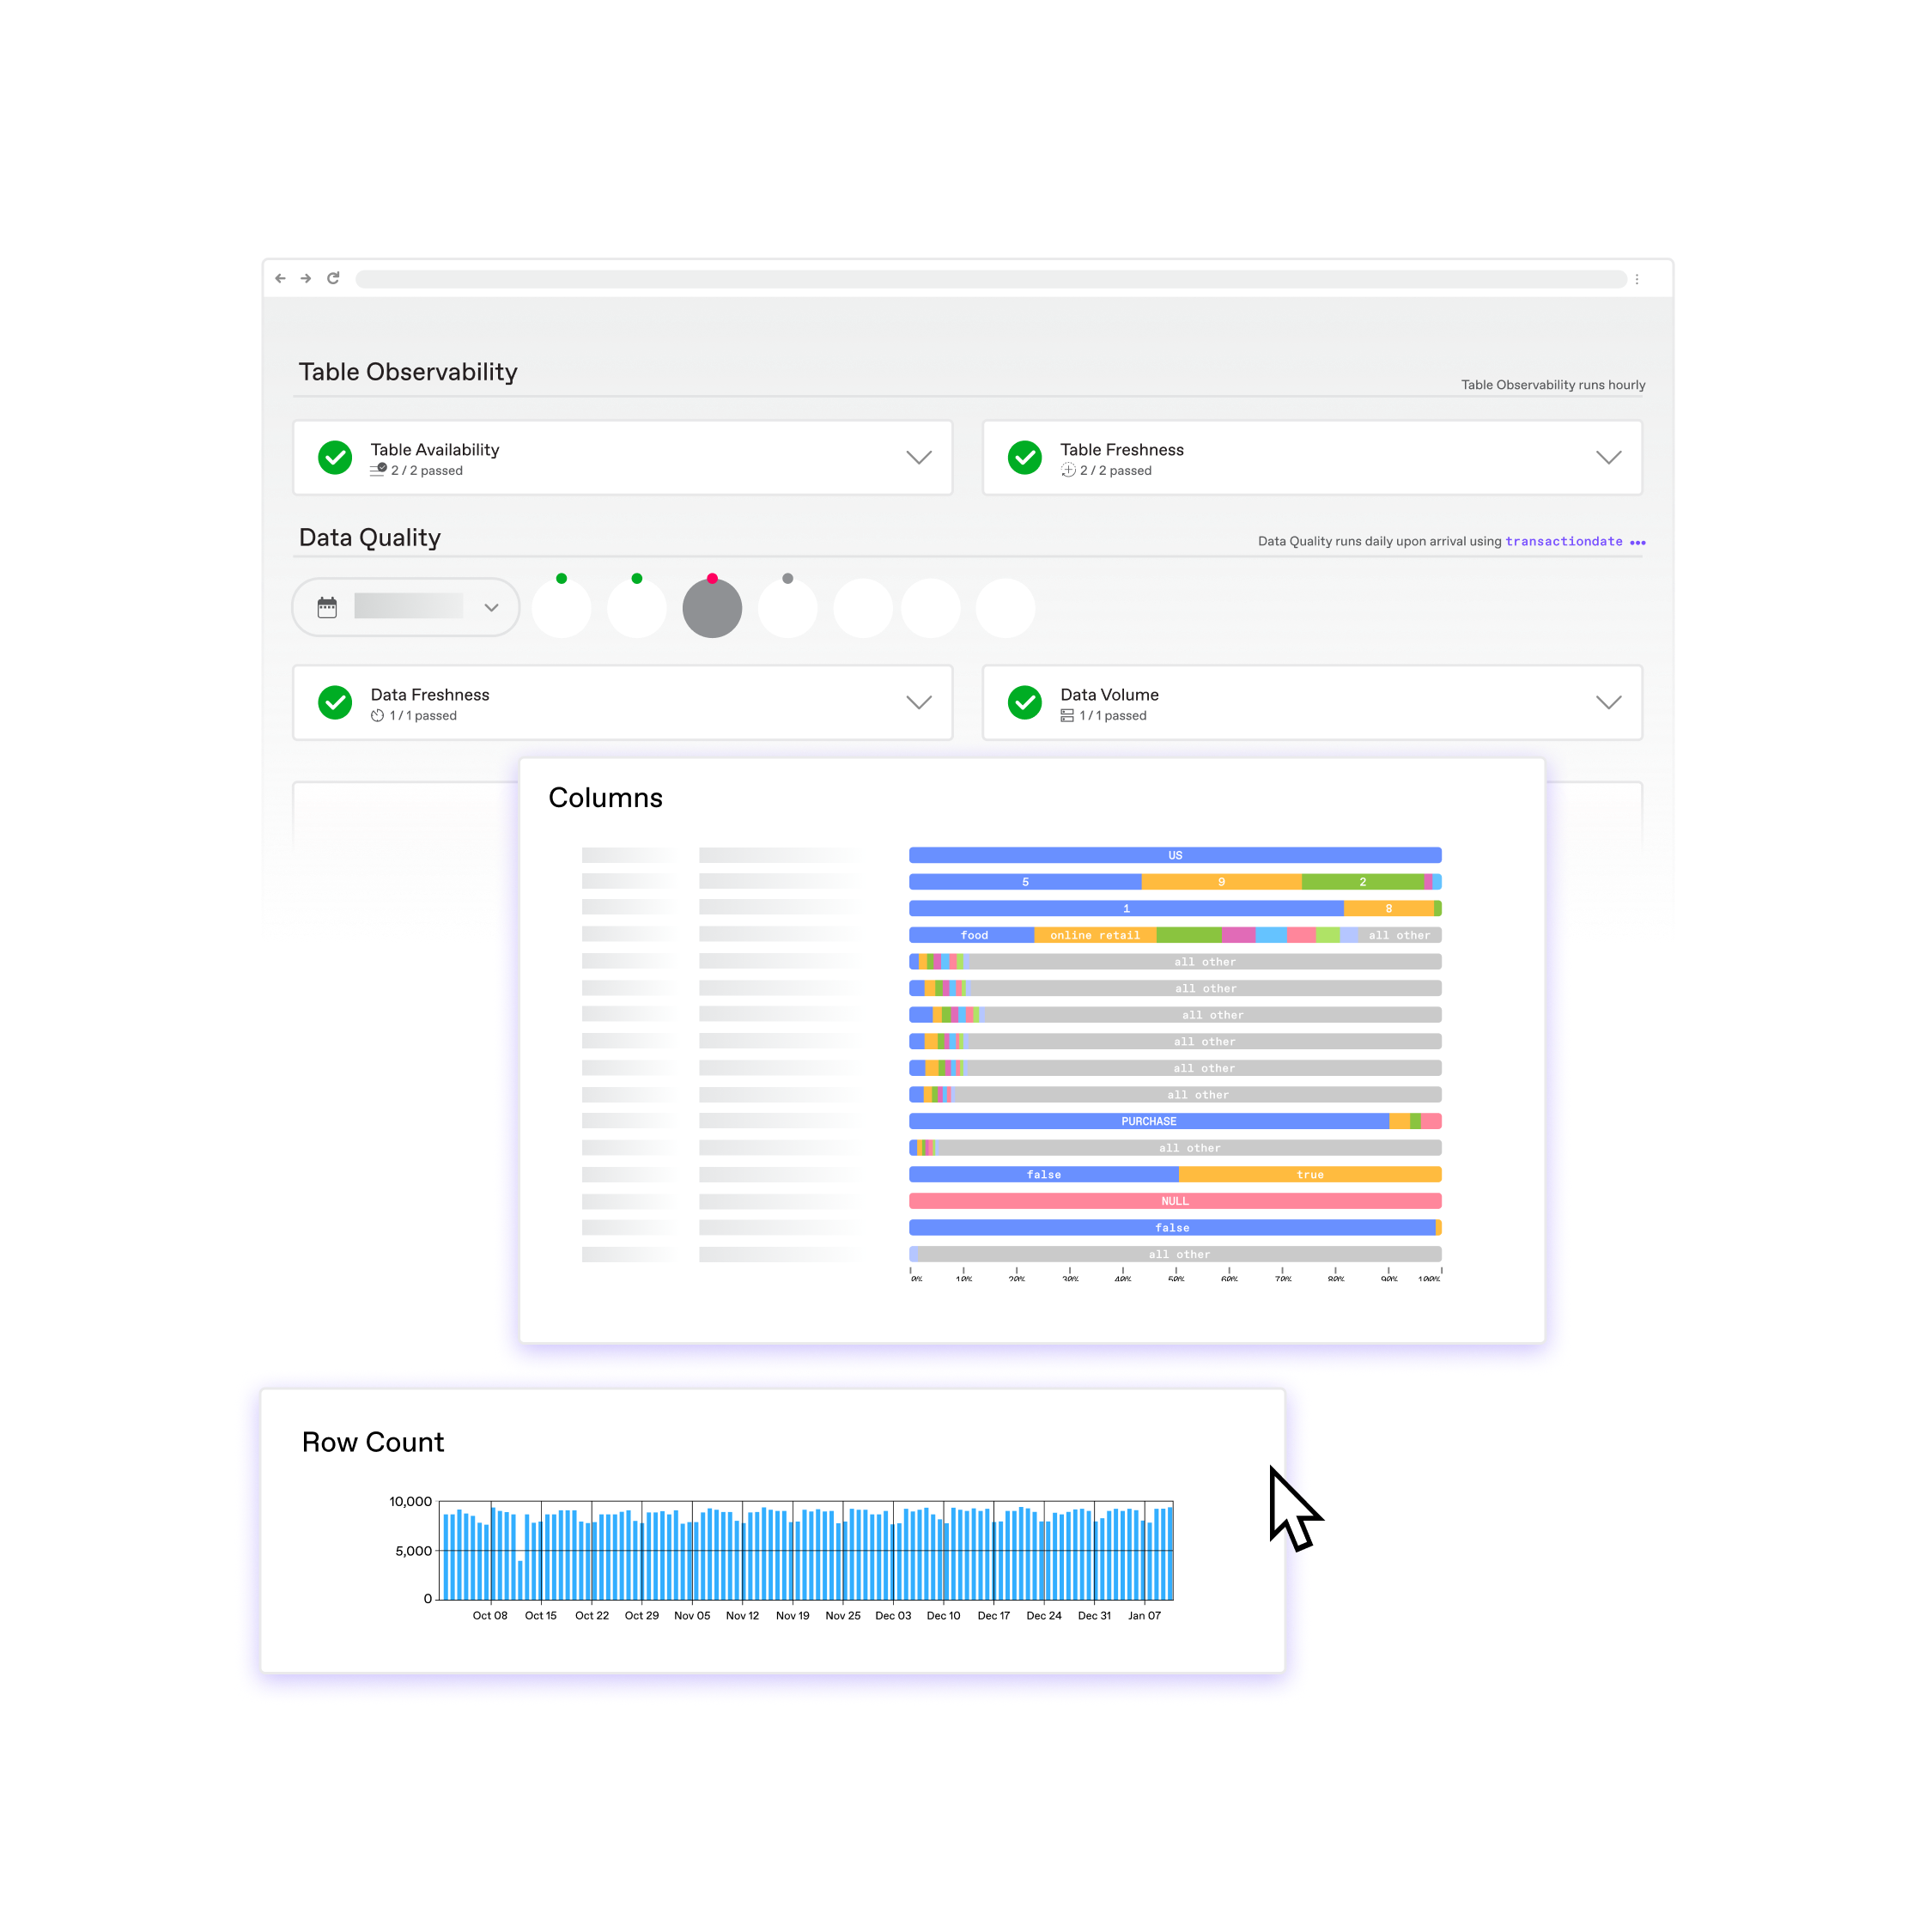
Monitor table availability and data freshness across your entire warehouse automatically and at low cost
- Ensure every table’s data is consistently delivered on time and with completeness
- Find broken pipelines before they affect models and dashboards
- Easy for everyone, API or no-code configuration
- Accelerate compliance and data governance programs


Data Pipeline Monitoring
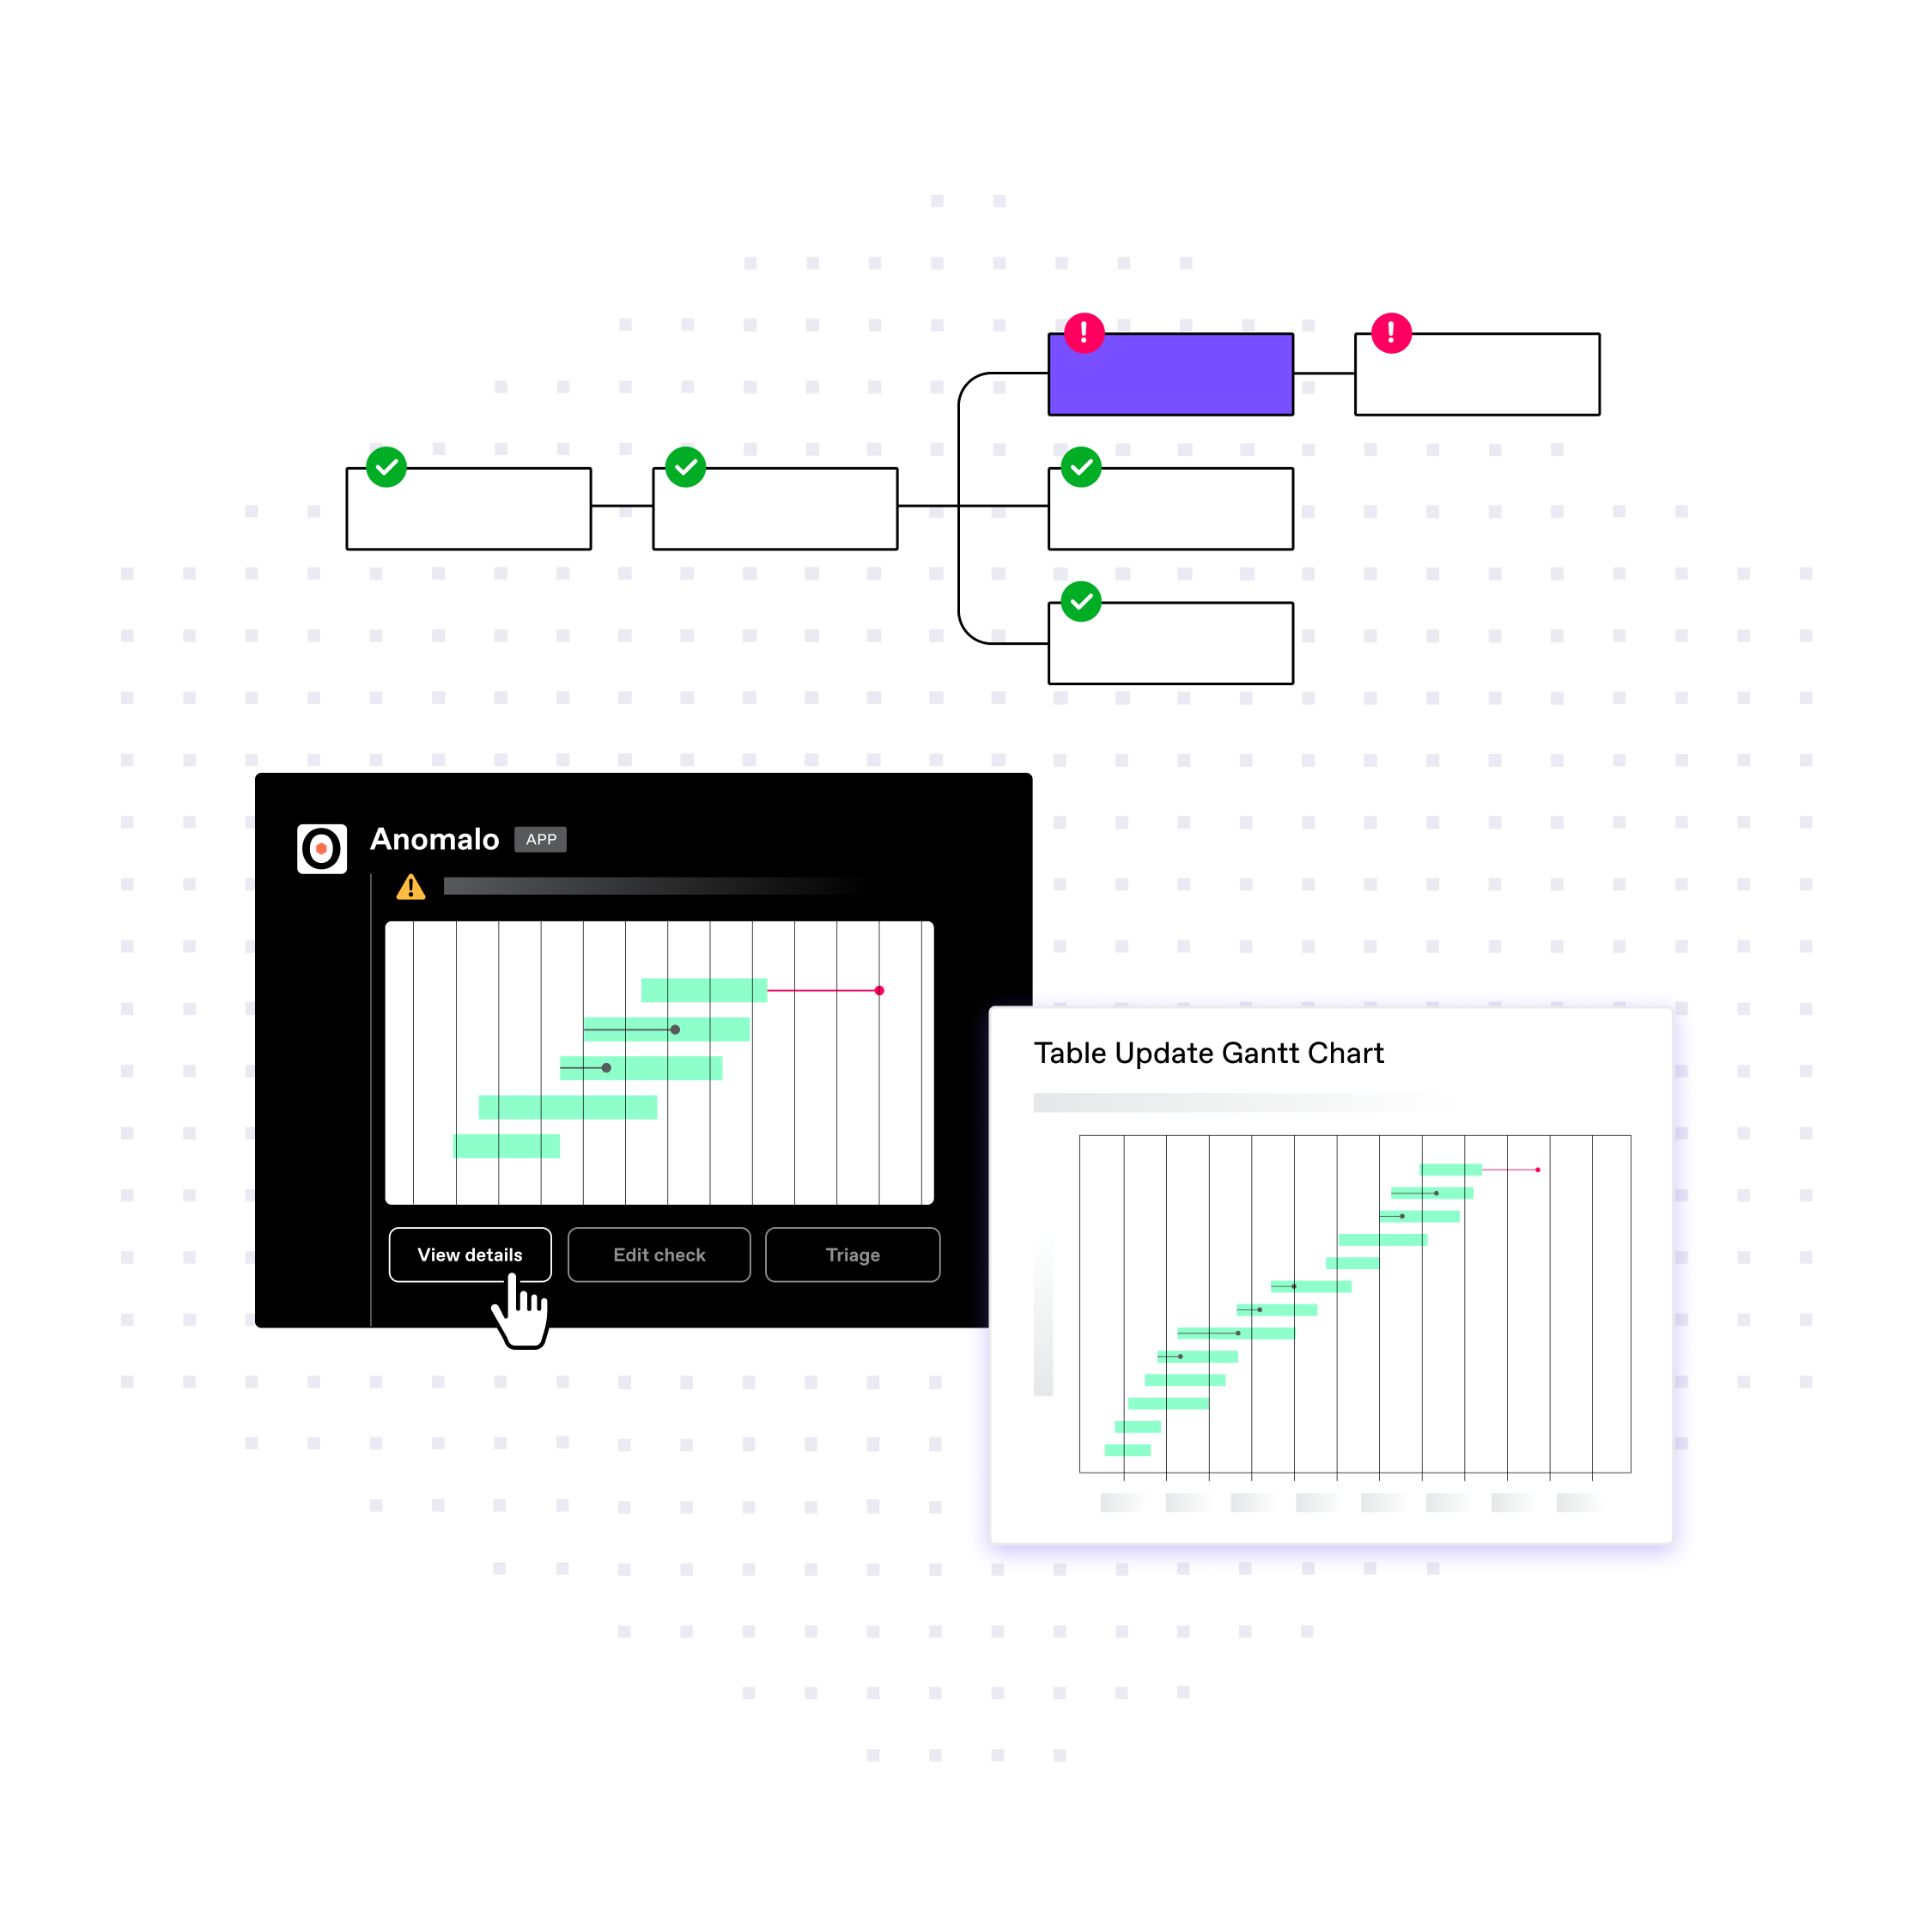
Identify pipeline interruptions, fast
Pinpoint issues with pipelines before they affect downstream data consumers.
- Know when tables aren’t updated on time
- Detect when updates don’t add the expected number of rows
- Get alerted if columns or tables are accidentally dropped
Data Management
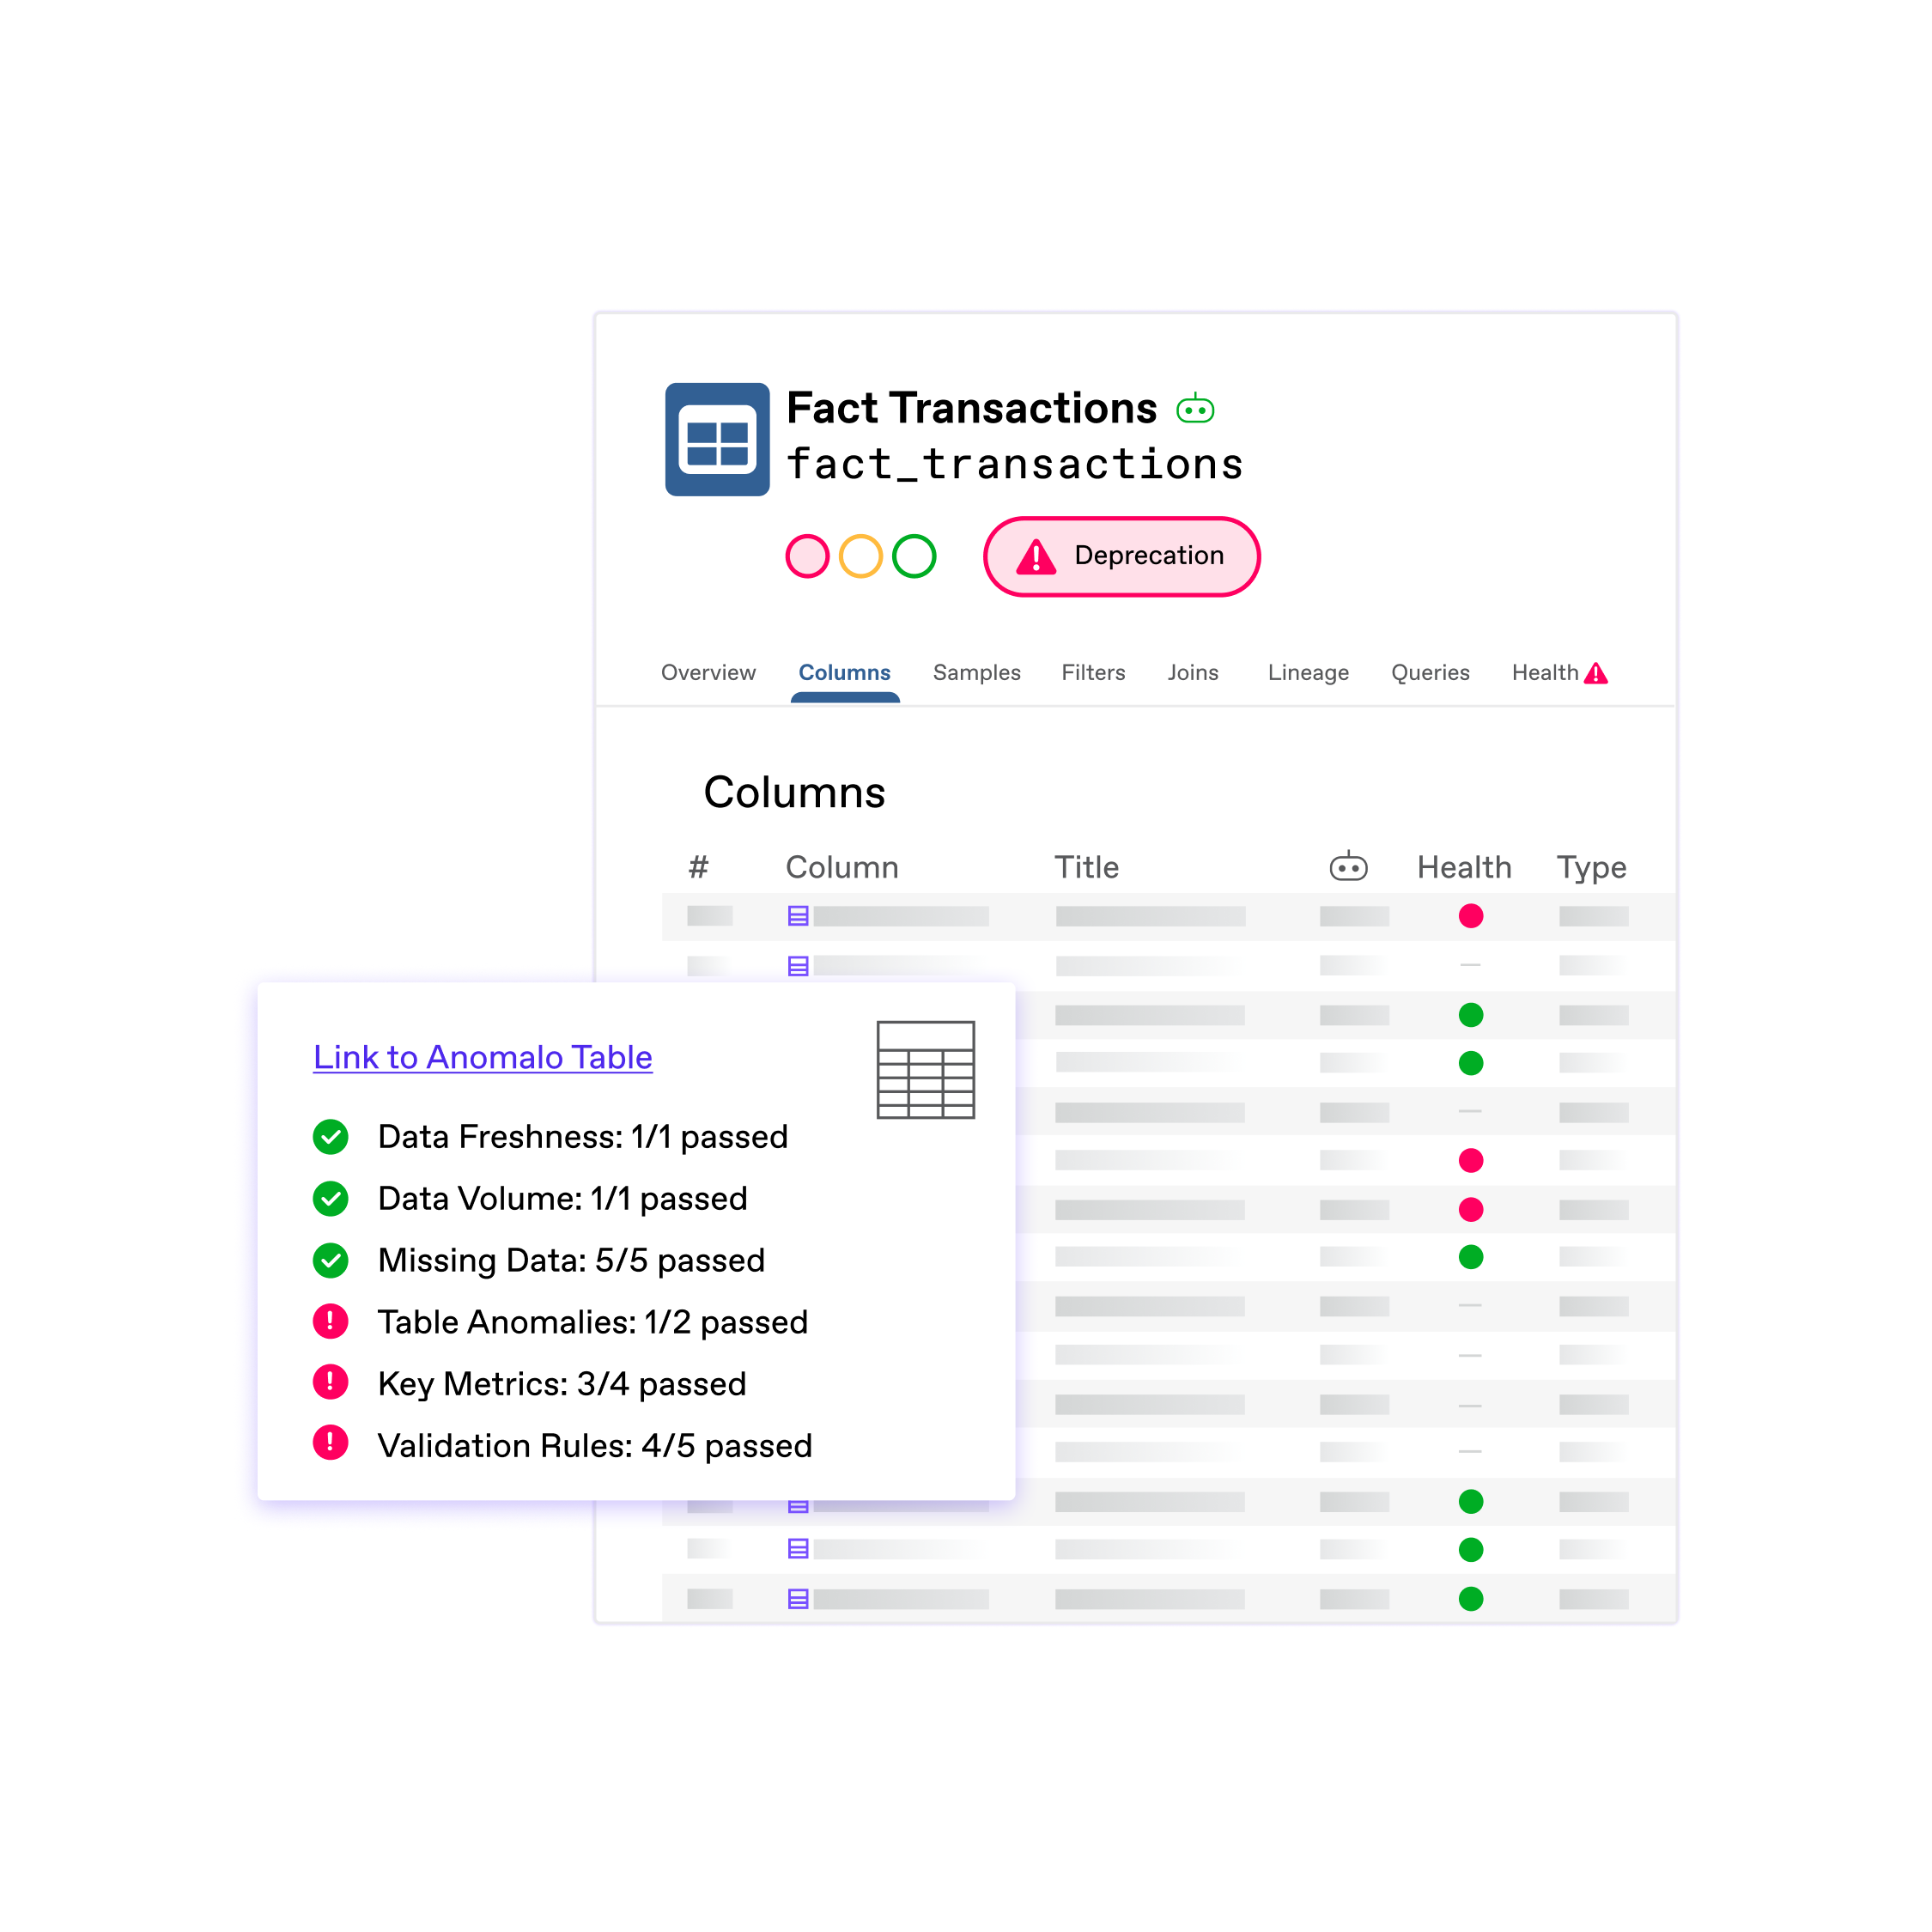
Bring governance and compliance to your entire warehouse
Automatically monitor every table and track quality initiatives across your organization.
- Integrate with data catalogs
- View trends and repeat offenders in an executive dashboard
- Explore data lineage for any issue


Data Reliability
Build on a baseline of trust
Ensure teams spend more time working with your business data, and less time questioning it.
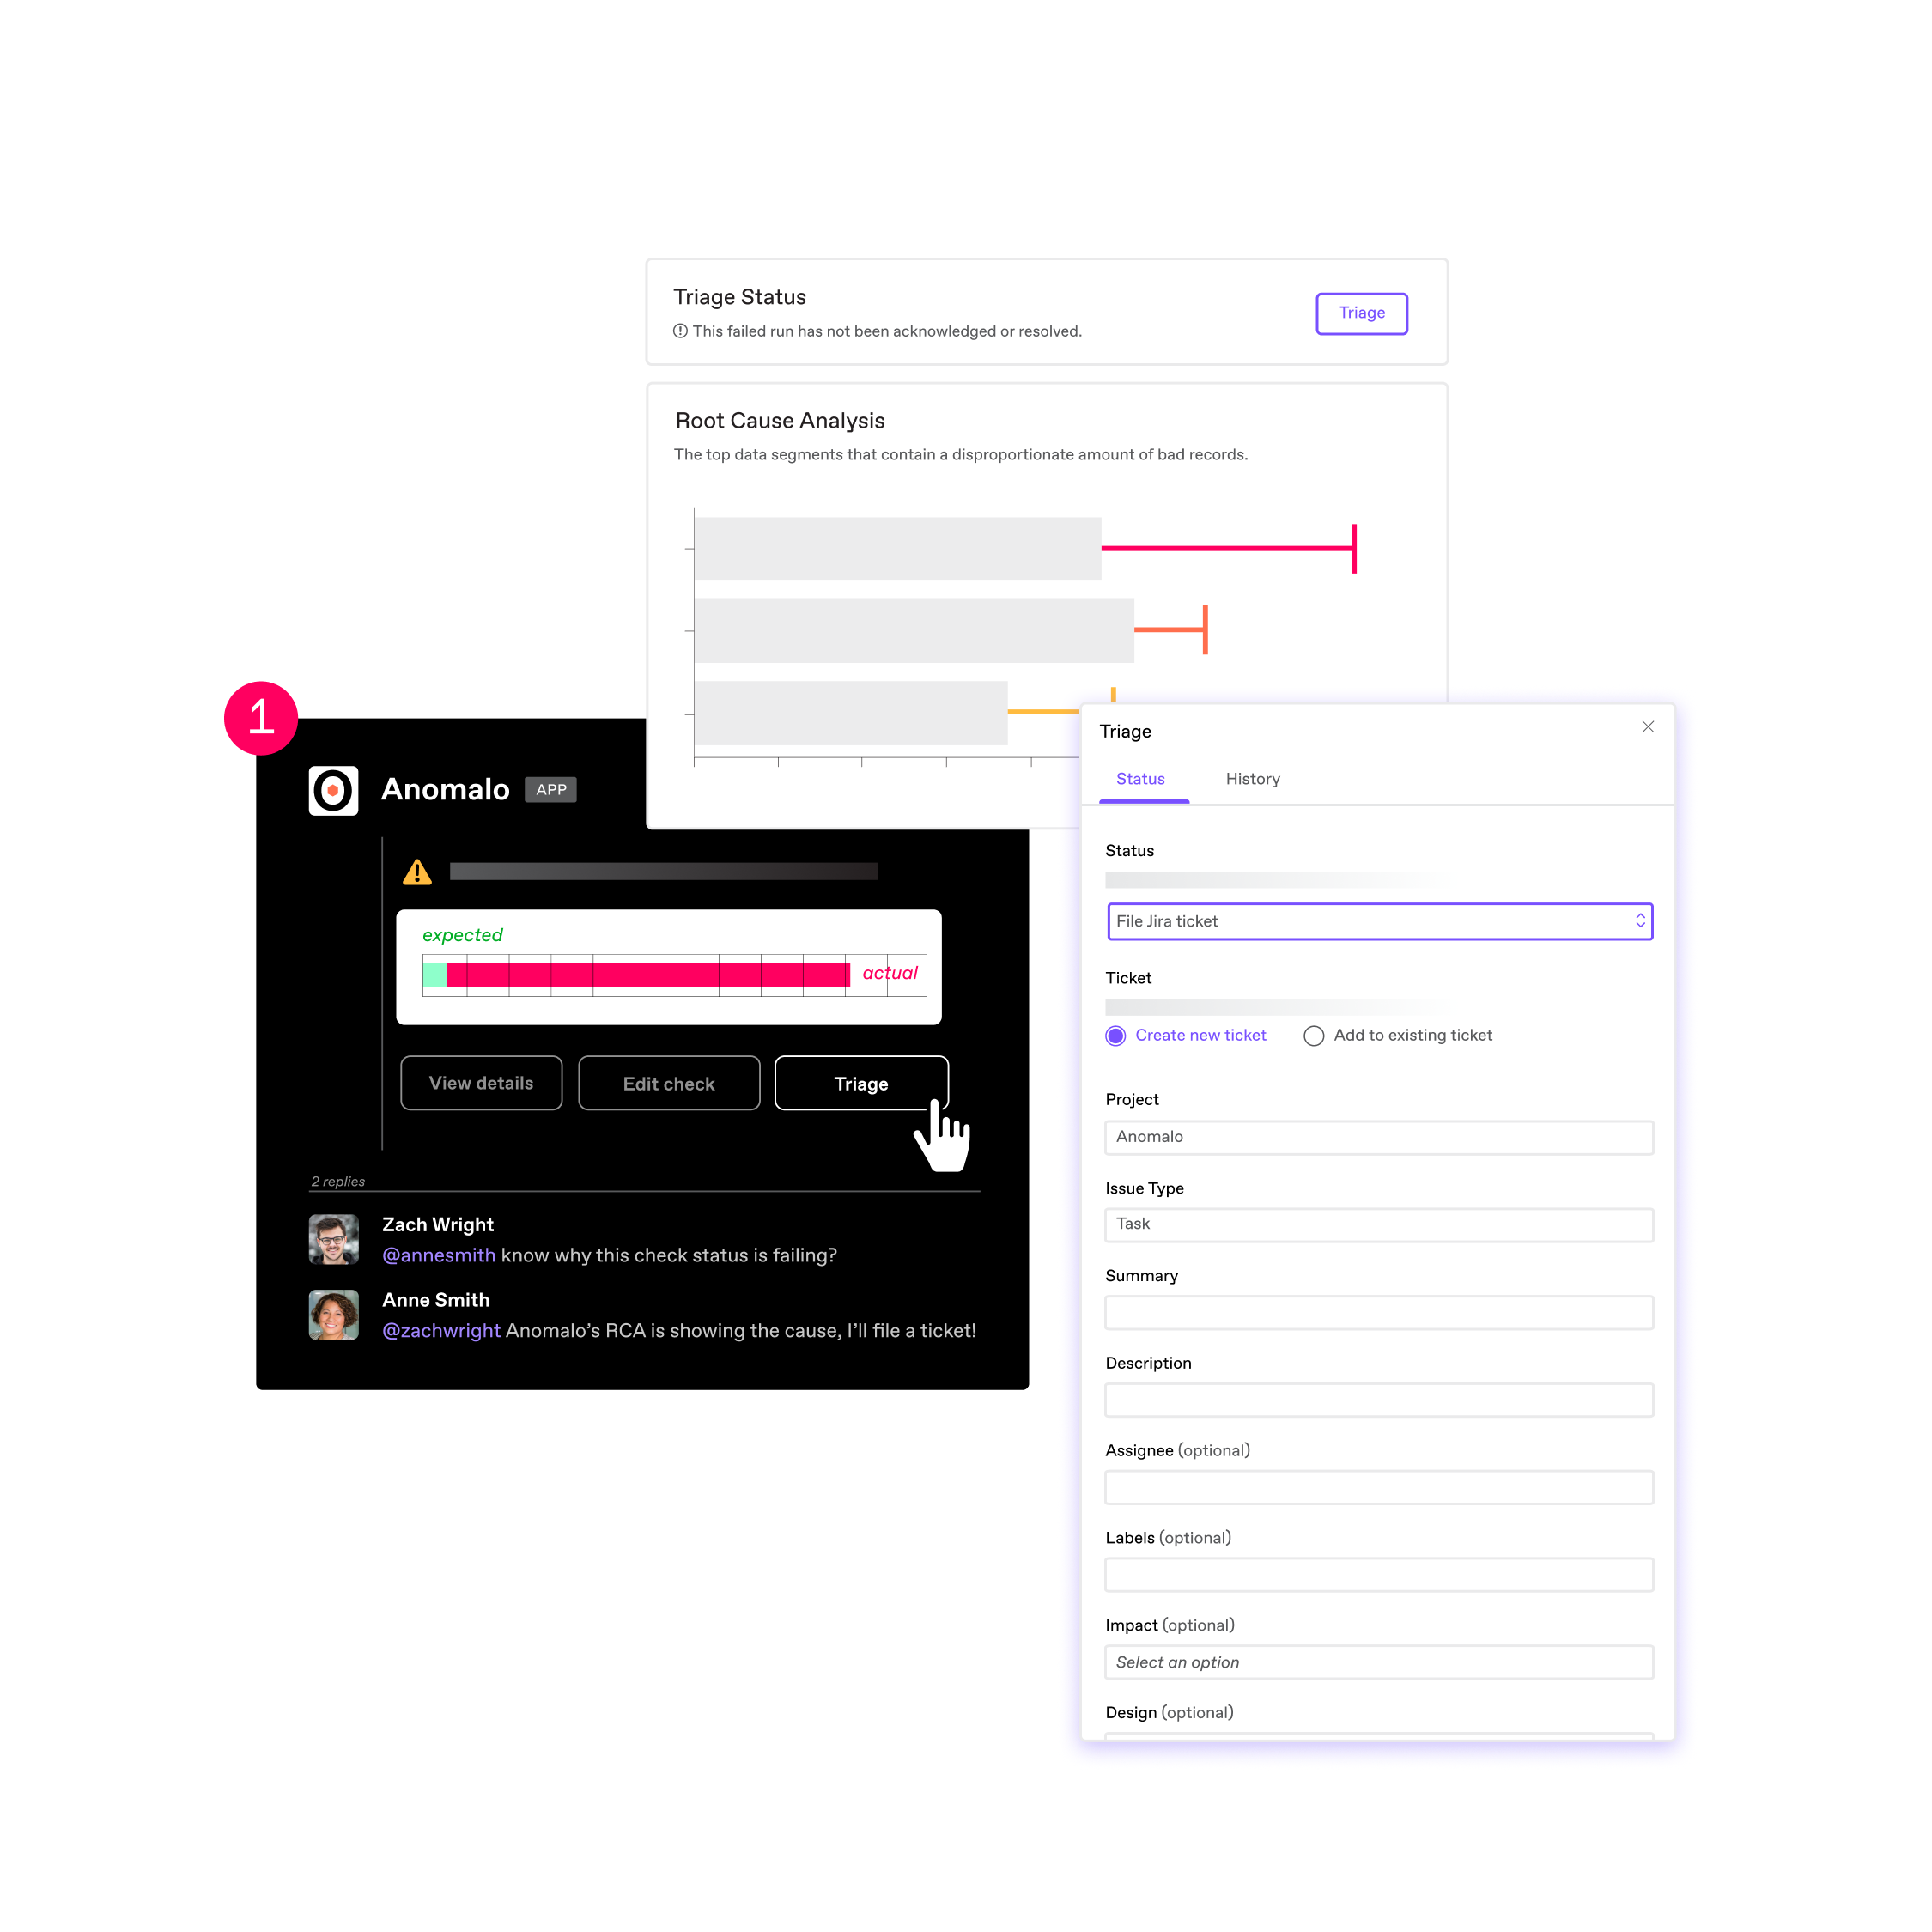
- Find, triage, and fix unreliable tables quickly
- Notify impacted users whenever there’s a data outage
- Empower teams to become more data-driven
Ready to Get Started?
Key Benefits
Data Observability Platform
Go deeper with comprehensive data quality monitoring
Unlike other platforms, Anomalo offers more than data observability. We use AI-based anomaly detection to find changes in the data values themselves, along with validation rules and data quality metrics monitoring for your most important tables.
Visibility that scales to all your tables
In minutes, you can configure observability checks for your entire data warehouse at a low cost. Instantly pinpoint problematic tables and bring trust to your data operations.
Migrate with confidence
You can easily set up Anomalo to compare tables before and after a data migration. Observability ensures that your data is consistently replicated in new environments.
FAQ
Frequently Asked Questions
If you have additional questions, we are happy to answer them.
How often does Anomalo’s data observability monitoring run?
To ensure a cost-effective solution, Anomalo retrieves metadata for your tables on an hourly basis. Table observability checks evaluate the state of the table based on the retrieved metadata. You can choose to run checks more or less frequently if you desire, using advanced configuration options.
What are examples of the kinds of data quality issues that data observability can find?
Anomalo checks for four main kinds of data observability issues. First, Anomalo will confirm that the table or view exists. If you have a table that is dropped and replaced regularly, this check will fail if the table is not successfully replaced. Second, Anomalo will check that columns have not been dropped in the last 24 hours. Third, Anomalo will look for patterns when your table is updated. If your table is not updated within the typically expected timeframe, based on historical behavior, this check will fail. And fourth, whenever there is an update in the table, Anomalo checks that the row number (or the size of the table) is not below the expected number of rows, based on historical patterns. This eliminates the possibility that a large amount of data in your table was deleted or that the normal operation of your data pipelines, which typically add rows to your table, was interrupted.
What types of data sources and formats does Anomalo support?
Table observability checks are supported for BigQuery, Snowflake, and Databricks tables. The data itself can be in any format, as the observability checks use metadata from your tables rather than looking at the data values themselves. Note that table freshness checks, specifically, are not supported for views and Databricks external tables.
How does Anomalo’s data observability platform integrate with existing data tools and workflows?
Anomalo offers one-click integrations with all the components of your data infrastructure, including all major data warehouses/lakes/lakehouses. Data engineers can also run Anomalo’s checks as part of your ETL pipeline via our integrations with orchestration tools like Airflow and dbt. Additionally, you can connect Anomalo to a data catalog like Alation to ensure that data observability is accessible to all business users.
How does Anomalo go beyond data observability?
Data observability is a great start for data analysts and data teams to establish a baseline of data quality across an organization’s entire warehouse in a cost-effective way. For your key tables, however, you most likely want to go deeper and monitor the data values themselves. Anomalo is designed for exactly this by offering a suite of AI-powered checks that automatically learn the historical patterns of your tables to detect anomalies in specific columns or segments. We also offer rules and metrics monitoring you can configure with no code. Rich visualizations, including data lineage, help you triage and root cause any data issues.
What algorithms does Anomalo utilize for anomaly detection?
Anomalo uses unsupervised anomaly detection techniques. Taking on a sample of 10,000 records from the most recent data and comparison samples from previous days, our machine learning algorithms will search for ways that the existing dataset is different from those previous days. If detected changes are above a dynamically adjusted threshold, which is based on the historical data “chaos” or levels of fluctuation in the data infrastructure, this check will fail.
How much time do Anomalo’s models need to learn about my data?
The machine learning algorithms need to run for 2 weeks to produce useful results. Results will continue to improve over the next 30–60 days. When a table is newly configured, the dynamically-adjusted threshold will be set to the maximum score, which requires anomalies to be extreme. Gradually, the threshold will decrease as the anomaly detection algorithms learn the expected chaos for the table.
How does Anomalo’s root cause analysis help me understand anomalous data points?
With automated root cause analysis, you can download a sample of a “good” and “bad” data point every time Anomalo flags an issue. Anomalo also will highlight the columns and data segments that contain the largest portions of anomalous data points, compared to normal data. These tools and visualizations will help you pinpoint the anomaly in your data.
Get Started
Meet with our expert team and learn how Anomalo can help you achieve high data quality with less effort.


