Automated Data Quality Monitoring with dbt and Anomalo
October 18, 2022
If you frequently work with business metrics, you probably know the feeling of wondering if you can really believe what the data is telling you. Across various BI tools, even core metrics like ARR are defined differently, creating confusion. Meanwhile, data quality issues like missing data and schema changes erode trust. You end up questioning whether your metrics truly reflect the state of the business.
To make data-informed decisions with confidence, you need enterprise-critical metrics to be consistent, precise, and validated. You need to know that your metrics won’t change when you switch tools. You also need to be able to trust that your metrics are continuously monitored to catch any potential data quality issues.
That’s why dbt Labs and Anomalo are partnering to ensure trustworthy and accurate metrics across your organization. With dbt metrics, a component of the new dbt Semantic Layer, you can centrally define business metrics that can then be queried and accessed in downstream analytics tools and platforms, such as BI, notebooks, and other data apps. With Anomalo, you can monitor the data that feeds these metrics to ensure that data quality issues are flagged and root-caused immediately, before they affect downstream tools and dashboards.
Anomalo + dbt ensures consistent, accurate business-critical metrics
With dbt and Anomalo, it’s now easy to build and monitor metrics you can trust to drive informed, data-informed decisions.
The dbt Semantic Layer provides consistency and accuracy in the definitions of key business metrics across various applications. Using dbt metrics, you can abstract metric calculations out of pre-aggregated tables or specific BI tools, so all your business-critical metrics can be defined once and queried everywhere.
When you have universal metrics definitions, how do you also guarantee that these metrics are accurate and reliable? This is where Anomalo comes in: the leader in data quality monitoring and observability, Anomalo automatically, continuously monitors your important tables so you know you can trust the data that feeds your key metrics.
Said Cameron Afzal, Product Manager for the Semantic Layer at dbt Labs, “We’re excited to partner with Anomalo to help customers proactively monitor the reliability of dbt metrics they’re querying using the dbt Semantic Layer. Anomalo’s data quality monitoring solution automatically detects data issues related to dbt metrics and allows data teams to understand their root causes before they impact downstream tools, meaning everyone in the business can operate with more confidence.”
How the integration works
One of six categories of data quality checks, Key Metric checks are an important piece of Anomalo’s data observability platform. These checks allow you to monitor any business metrics in Anomalo and be notified when metrics have changed dramatically. You can pick from 54 out-of-box metric checks in Anomalo’s no-code UI, or monitor a custom metric using SQL. All Key Metrics checks come with powerful visualizations that help you understand the root causes of any anomalies. No more wondering why a metric looks suspicious and whether it points to a data quality issue or a real trend.
As dbt’s first “Metrics Ready” data observability partner, Anomalo will now automatically start checking metrics that are defined in dbt. This means that when you monitor a dbt model in Anomalo, not only will you get Anomalo’s entire suite of data quality checks by default, but you’ll also get Key Metric checks for each of your dbt Metrics for that model. The metric definitions are synced and consistent across the two platforms, so data stakeholders can always have confidence in the numbers they care about.
Example
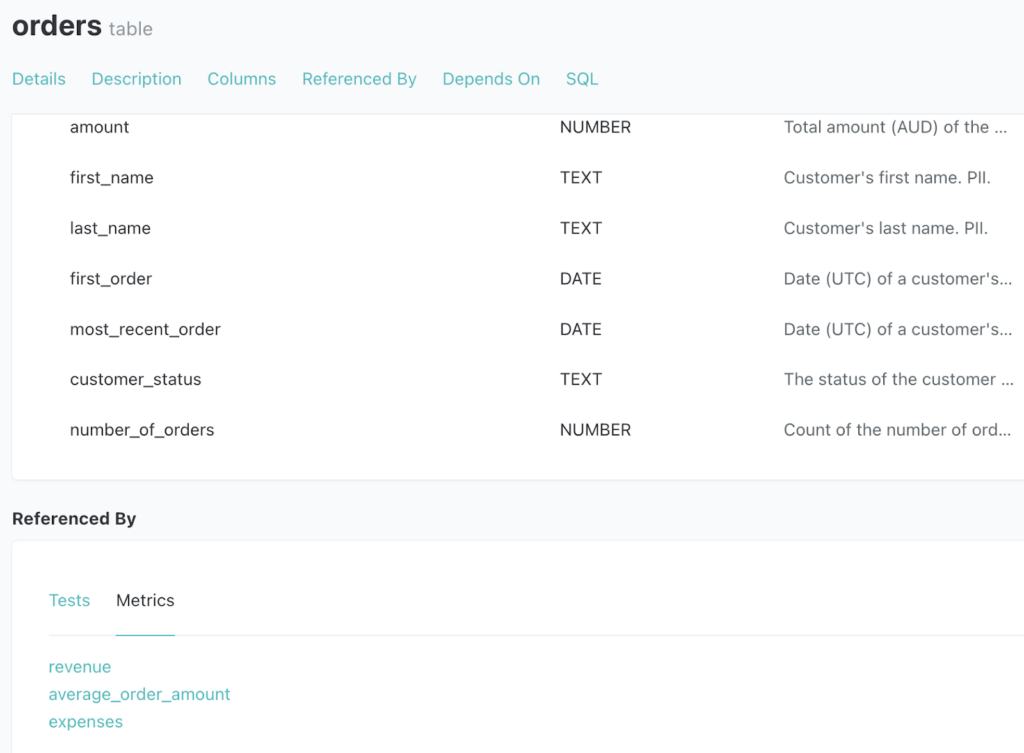
To use an example borrowed from the Jaffle Shop Metrics GitHub project, let’s say that we have a customer orders model where we’ve declared the following dbt Metrics to track for our business:
- Total revenue
- Average order amount (or AOV)
- Total expenses
Here’s what that model looks like in dbt:
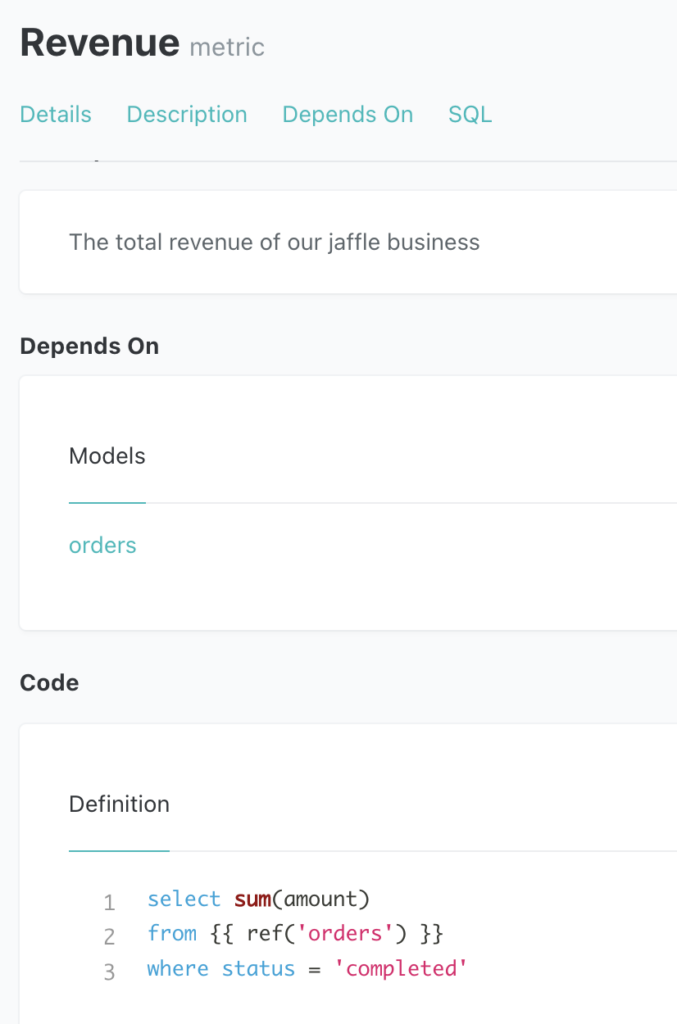
Drilling into the revenue metric, here’s how it’s defined in dbt. Revenue is derived from the sum of the “amount” column, and also by applying a SQL filter where status = “completed.”
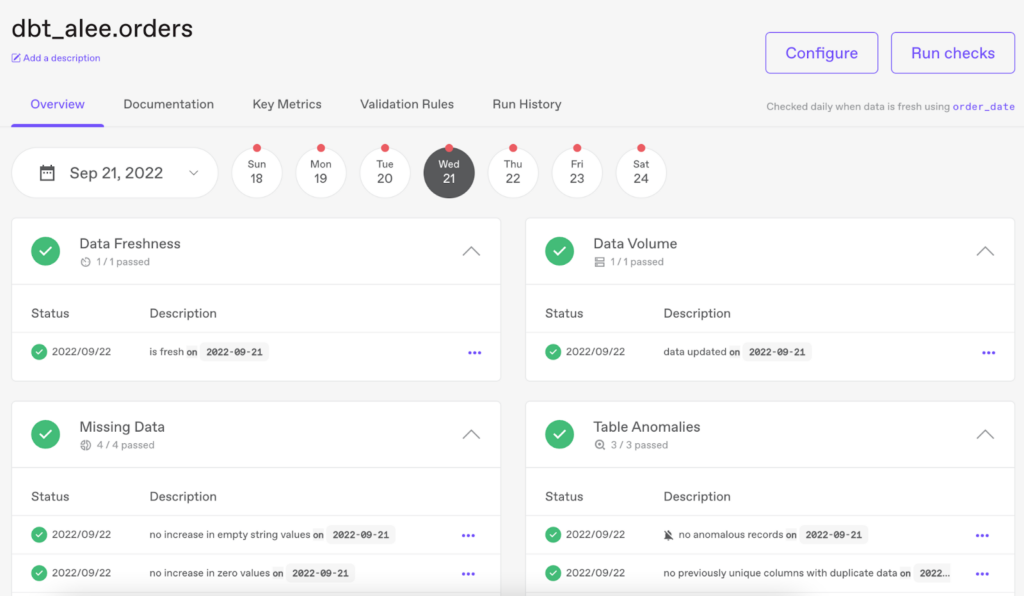
Now, if we look at the orders table in Anomalo, we can see that it’s automatically being monitored daily for data quality issues. Data Freshness checks that data has arrived; Data Volume checks that the incoming data is of sufficient size; and Missing Data checks for any changes in drops, nulls, or empty values. Table Anomalies checks use our unique machine learning algorithm to identify changes in continuous distributions, categorical values, time durations, or even relationships between columns.
With the addition of the new dbt Metrics integration, Anomalo will also automatically monitor all the metrics that were defined in the dbt model. It does this by instantly converting each dbt Metric into its corresponding Key Metrics check in Anomalo.
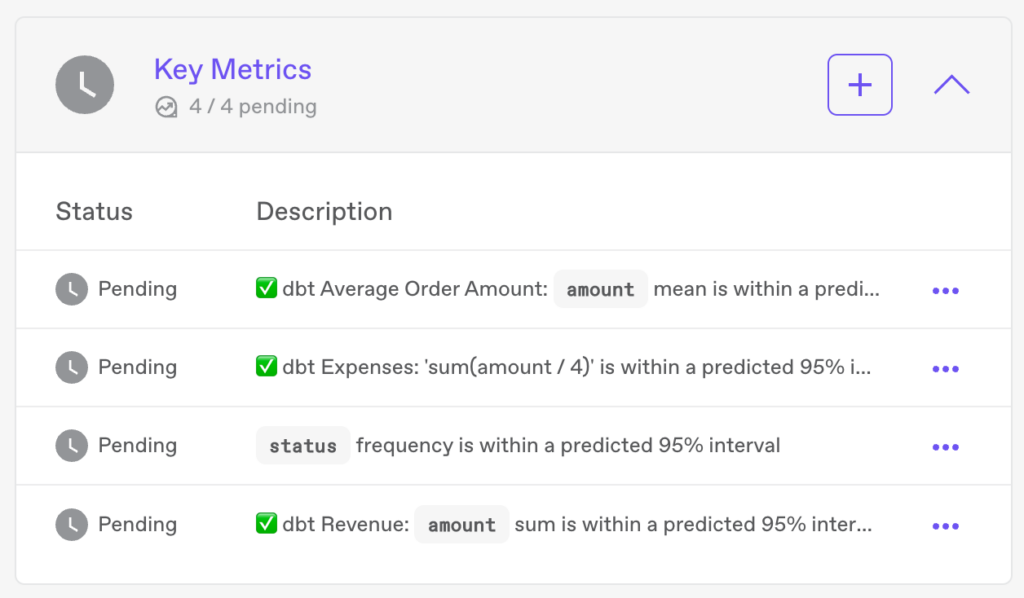
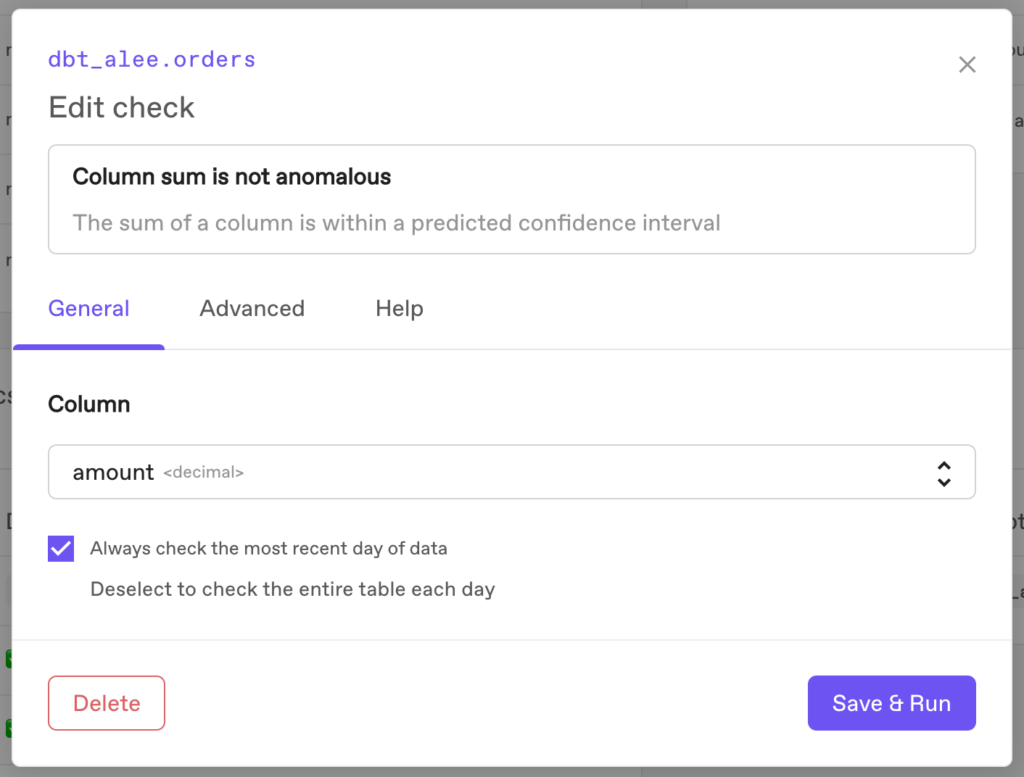
rilling into the new “dbt Revenue” Key Metric check, we can see that Anomalo is using the precise metric definition from dbt. Because dbt defines Revenue as an aggregative sum, Anomalo will use the “Column sum is not anomalous” check.
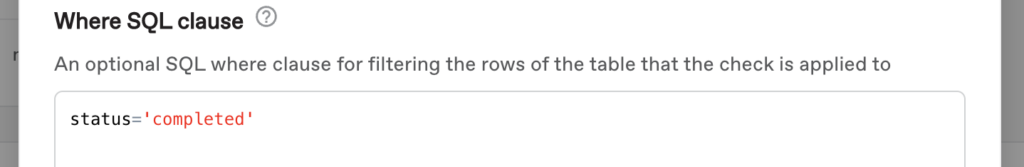
It inherited the SQL filter as well:
If you want to check for other variations in this metric (for example, “Column mean is in a range”), you can always modify or add a new one in Anomalo’s low-code/no-code interface. The integration will automatically convert all available aggregative metric types dbt supports natively.
Monitoring key metrics in Anomalo
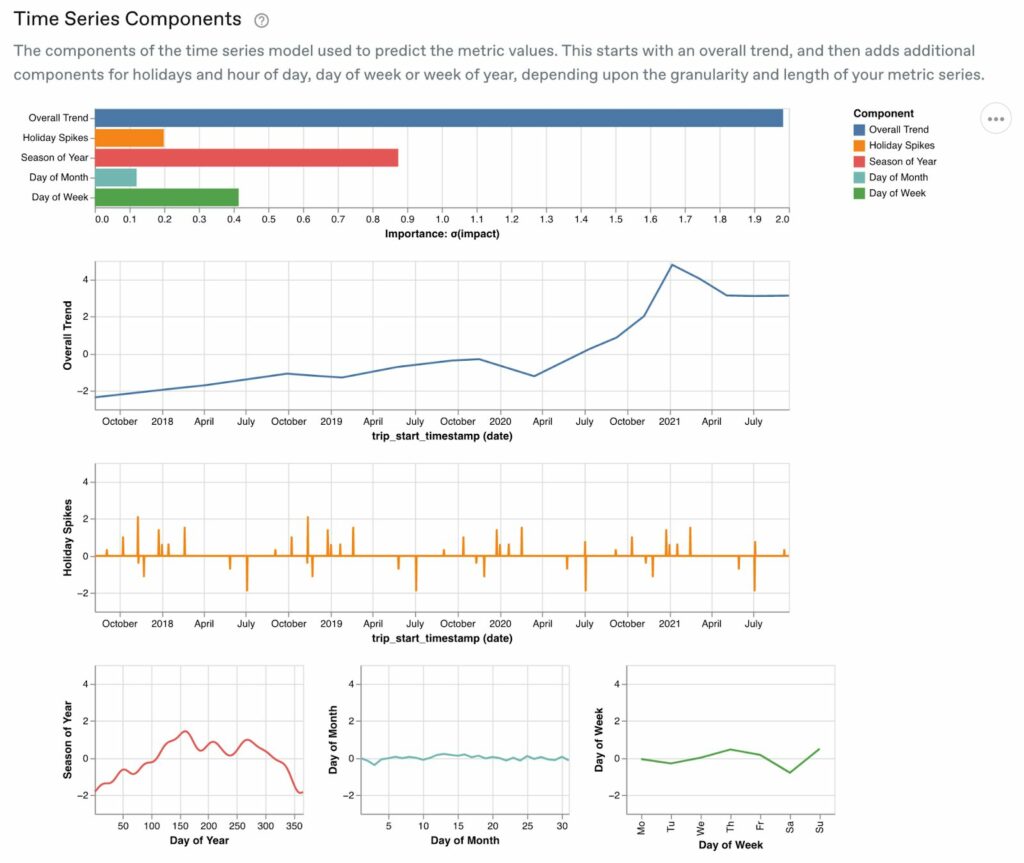
Anomalo’s Key Metrics checks alert you if a metric behaves abnormally and provide detailed visualizations.
Knowing when to trigger an alert is an important feature for data observability. Too often, false positives create noise that causes users to “tune out” notifications. Anomalo uses a sophisticated model that determines when an alert will be valuable. It’s able to adapt to fluctuations in the data caused by things like annual seasonality, day of the week, and slow data drift over time.
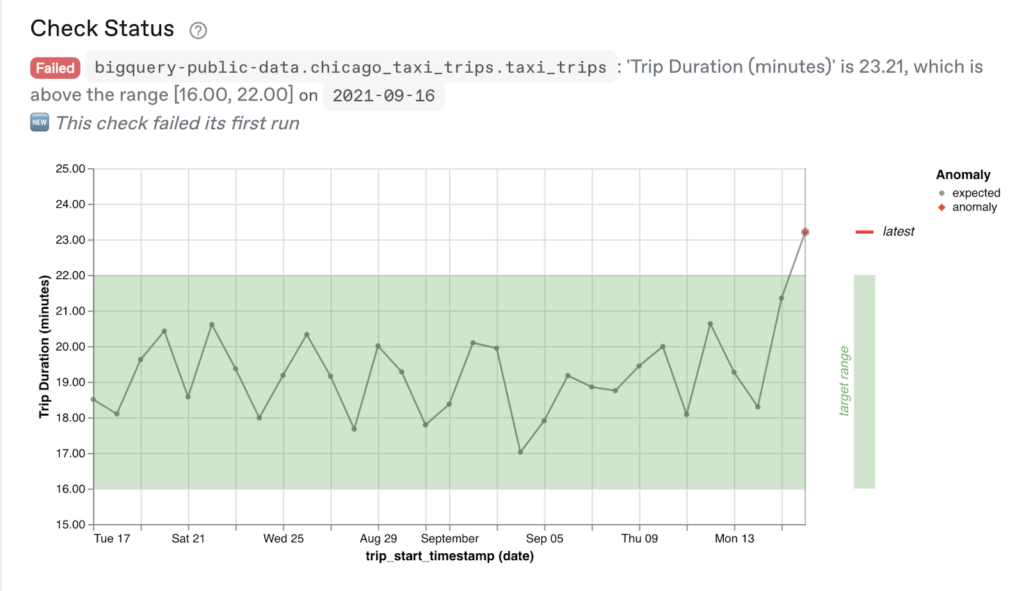
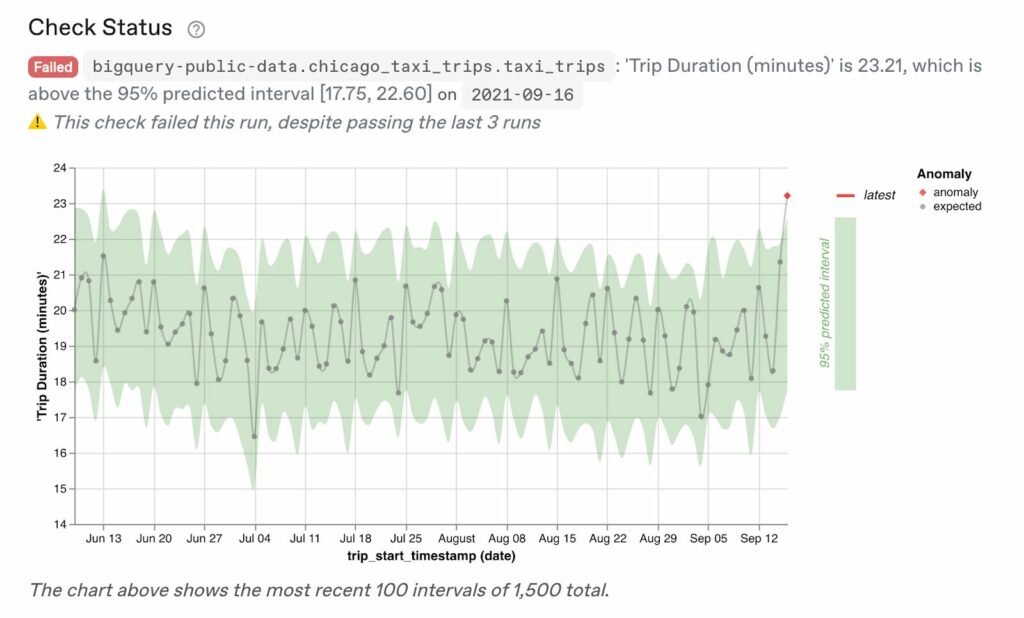
When you get an alert, you can then use Anomalo to determine why the metric changed. Here are a few examples of the types of rich visualizations that Anomalo provides for a metric:
Want to learn more?
With Anomalo and dbt, you can define consistent, precise business metrics that you can trust. To get started with dbt’s Semantic Layer, check outgetdbt.com/product/semantic-layer. To try Anomalo and see how it can help your business, sign up for a demo here.
Categories
- Integrations
Related Resources
Learn more by browsing our library of announcements, guides, and technical deep dives on data quality.


Ready to Trust Your Data? Let’s Get Started
Meet with our team to see how Anomalo transforms data quality from a challenge into a competitive edge.